Showing Microsoft Forms results in Power BI
A few days ago, someone asked me to think of a solution to show the responses of a Microsoft Form in Power BI. During this project, I used Forms, Power Automate, Excel, OneDrive, and of course Power BI. I found some interesting obstacles that I want to show you, but first, I start creating a form!
Microsoft Forms
Microsoft Forms can be used to get (customer) feedback, surveys, or registrations. You can ask different kind of questions:
- Multiple choice (including multiple answers)
- Open Answers
- Rating
- Datepicker
- Classification
- Likert scale
- File Upload
- Net Promoter Score (NPS).
For my project, I had multiple-choice questions, open answers, and Likert scale questions. For this blog, I’ll create a small form including some random example questions.
My questions in Microsoft Forms
OneDrive & Excel
The next part is creating a folder in OneDrive, and an Excel file including columns for all questions. I also include two columns: One for the e-mail address of the participant and one for the DateTime it was sent:

Columns for all questions
As you can see I created three columns starting with Likert. Each of the questions will send a unique result.
Power Automate
Within Power Automate you create a new flow and select a template. When you search “Forms”, you get all kinds of flows related to Microsoft Flows. The one we are looking for is this one:
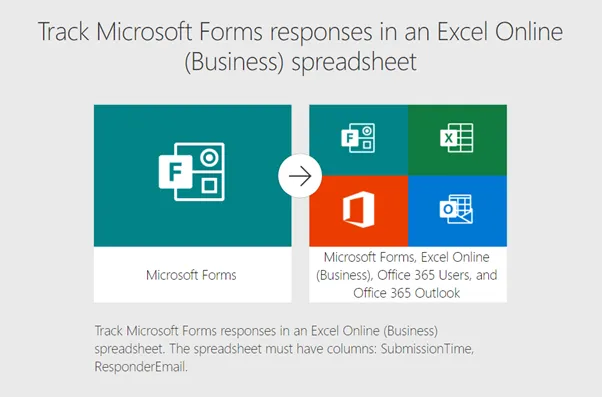
Track Microsoft Forms responses
Now it’s just basically filling in the blanks:
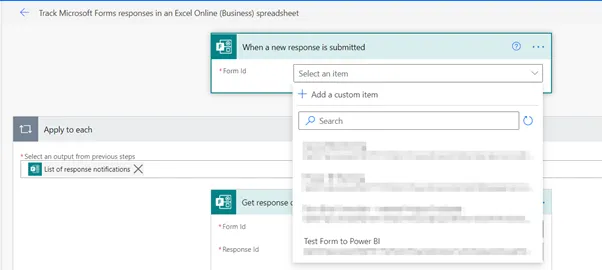
Select your form
Select your destination file
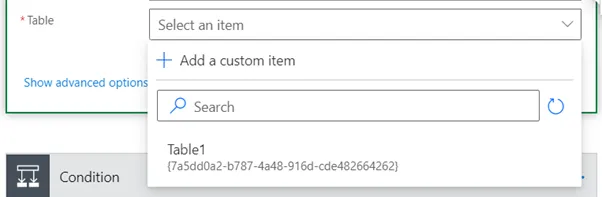
Select your table
Map dynamic fields to correct column
After you mapped all columns, you’re done! It’s time to test the flow! You can do this by selecting Test in the top right corner. While the test is running, I’ll fill the form. After that: Power Automate gives me this result:

Test Successful!

Result in Excel
Now I’ll fill the form a few times extra to get some extra data and then it’s time for the last chapter: Power BI!
Power BI
First, we have to create a new report and connect it to our data source. I once learned this trick to connect files which are in the cloud:
In Excel, go to info and copy the file path:
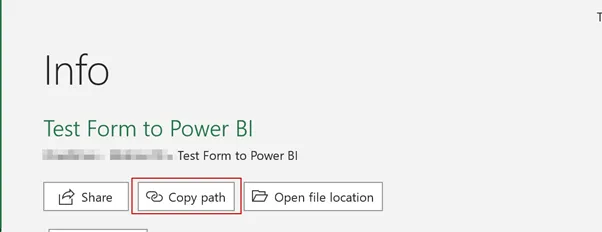
Copy Path
In Power BI, select the From Web connector, paste the path and remove the “?web=1” parameter.
Although a web connector only works with anonymous credentials, you have to enter the credentials of your OneDrive. You then get a warning that it only works with anonymous credentials, but it connects:
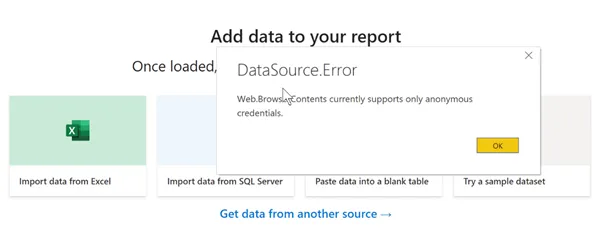
Click OK and the error will disappear
In the Query Editor, we can see that there are a few problems.
- There is no Identifier;
- Interest is a string, of multiple values, so I can’t count them.
First the identifier: I duplicate DateTime and Name and then merge these columns:
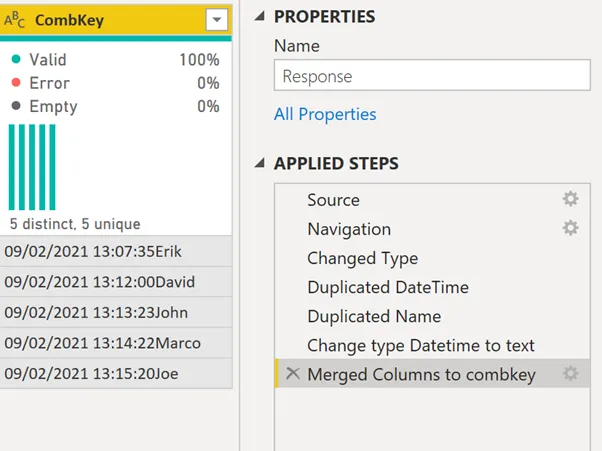
For the Interest column, I’m going to create a dimension with the unique options, and a hidden table with the CombKey and the interests.
First I create a reference to the first query and make sure I only keep the CombKey and Interest column. After that, I split the column into rows:
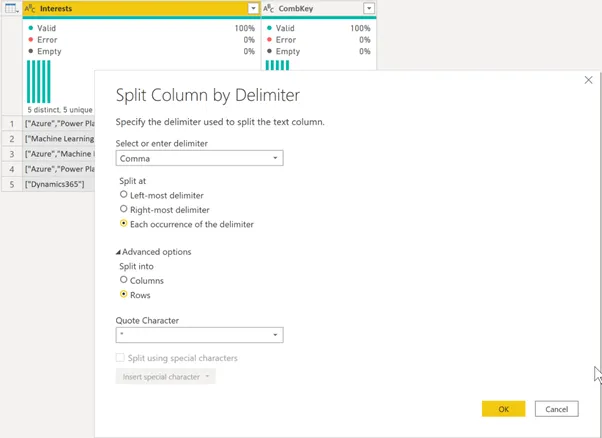
Split column into rows
After some cleaning, this is the result:
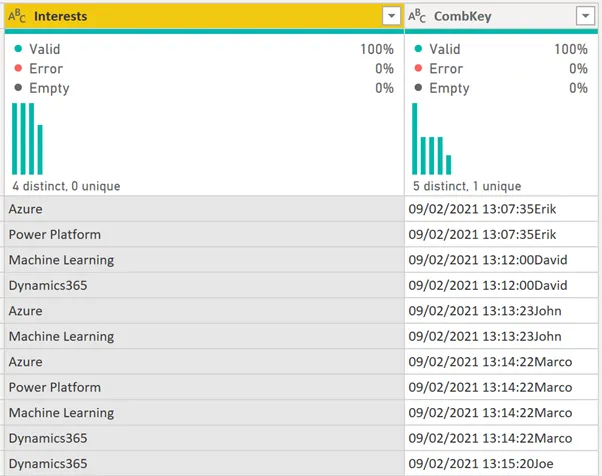
Interests Combkey Table
Now I create a new reference to the previous query and make sure I only keep the Interests column. After removing the duplicates, this is the result:
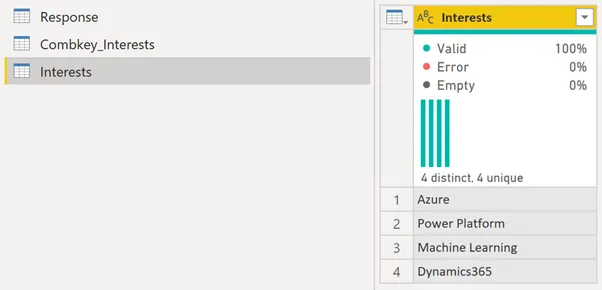
Interests dimension
In the data model I create the following relationship:
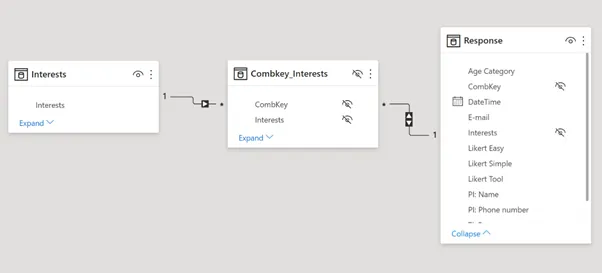
Relationship between Interests and Response
Now I can create a visual with Interests from my dimension table, and when I include an easy formula like:
# Response = COUNTROWS(Response)
I can see how many times someone marked for example Azure as an interesting topic.
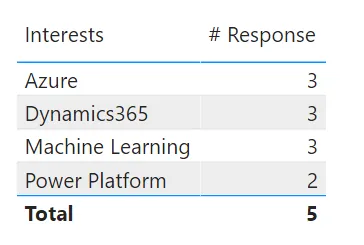
In 5 responses, 3 people found Azure interesting
Now for the Likert questions. This is not a nice way of showing the results:
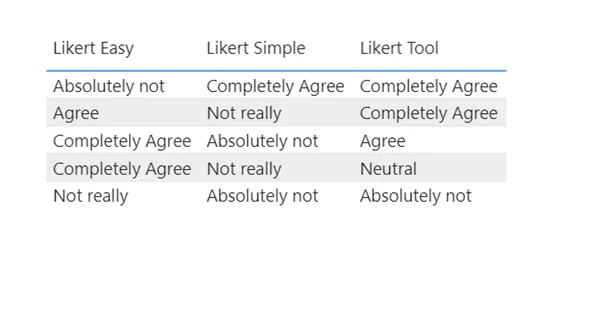
Likert
First of all, the “question” doesn’t make sense at all and it will be very difficult to put these questions in a matrix, showing the scores. So we will create something like before, but this time including some unpivot action.
I duplicate the CombKey_Interest query, but instead of keeping these two columns, I keep the Combkey and Likert columns. Then I rename these columns so they make a bit more sense. The next part is to unpivot the columns and rename them to Question and Answer.
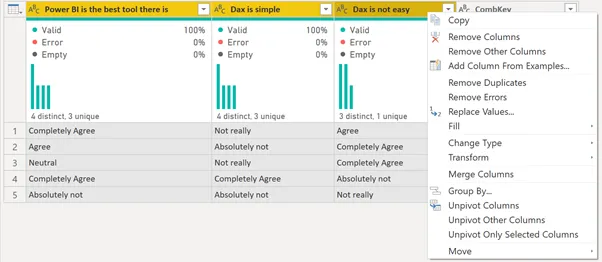
Select the newly named column and select unpivot Columns
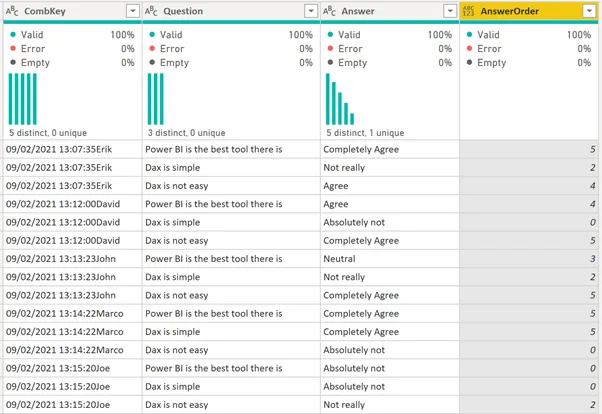
Unpivot table, renamed and added Order for Answer columns.
The next part is to create a dimension with only questions, the same way as Interest. After that, you create the same relationships as before and now you can make a matrix:
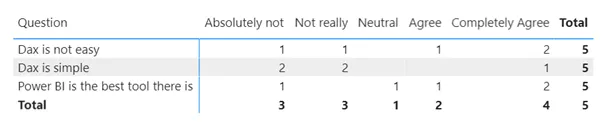
LikertQuestion[Question], Combkey_Likert[Answer], [# Response]
And as you can see, this works perfectly! Or does it? If we add the names to the questions and collapse everything, the responses don’t add up:
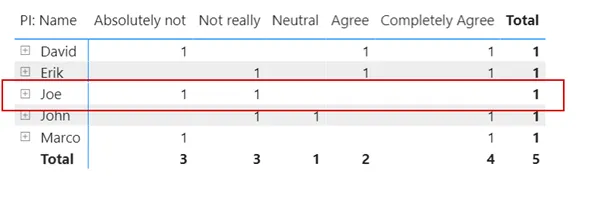
Three questions, only two numbers
This can be solved by creating a Sumx:
# Response Sum = SUMX(LikertQuestion, [# Response])
And here’s the result:
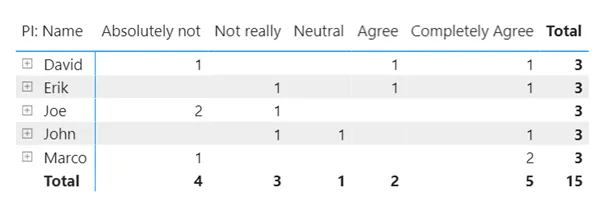
Result
Wrapping up
And that’s it! You can use these mechanisms for the other questions too and I hope this article will help you during your journey of Power BI, Power Automate, and Flow!
Take care.