In my latest blog, I wrote about using the Apache Atlas API to get full lineage from source to Power BI dataset and report. A few days after that Microsoft made an update to the lineage capabilities, one that makes me really happy! When using Azure SQL DB as a source, the lineage now works without any manual configurations! Even better, you can view where columns are coming from (also columns that you combine in Power Query or calculated columns) and when you select a measure, you can see which columns are used to create it!
So, let’s see what I’m talking about!
Power BI
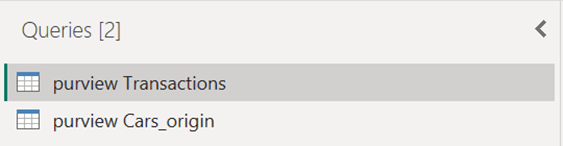
In Power BI, I load two tables from an Azure SQL DB:
In the Cars_origin query, I also add an extra column:

I’m dividing the amount of a car’s horsepower by the number of cylinders. Does this say anything? Probably not, but it’s only to show you how Purview works with that.
After loading the data in the report, I created some measures and a calculated column. I know the column doesn’t make sense, but again: for demo purposes. My calculated column is:
Kostprijs = 'purview Transactions'[Sales] - 'purview Transactions'[Gross Margin]For the measures, I created these:
% Horsepower =

DIVIDE(

    sum('purview Cars_origin'[Horsepower])

    ,CALCULATE(

        sum('purview Cars_origin'[Horsepower] )

        ,REMOVEFILTERS('purview Cars_origin'[Model])

    )

)


Cylindrs = AVERAGE('purview Cars_origin'[Cylinders])

Test Division = DIVIDE([$ Sales] , [Cylindrs])
Dividing Sales by the number of Cylinders also doesn’t make sense, but l wanted to see what happens if you create a measure from two different tables.
After that, I published the report, and went to Purview!
Purview
In Purview, I reran the scan of the Power BI tenant and after it was completed, I searched for the Power BI report that I just created. I clicked on the lineage tab and this is what I got:
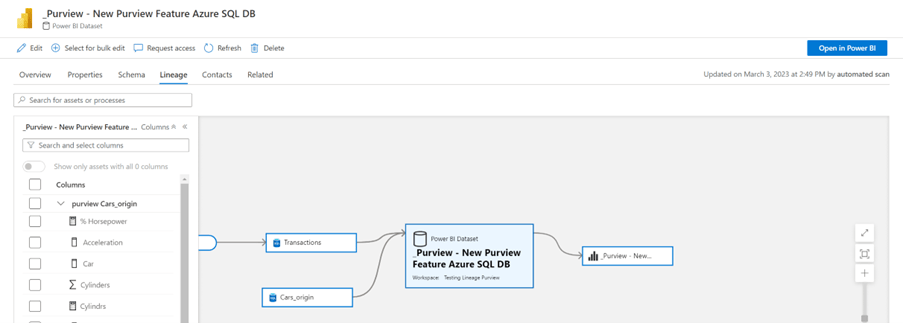
First I was happy, that I could see the table that was imported (instead of only seeing the server we connected to) but what made me happier was that I could see all the columns!
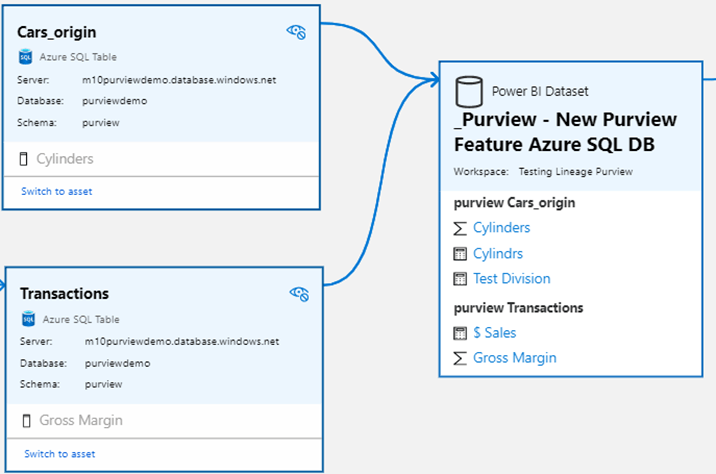
When you select all the columns, you get this result:

The Power BI dataset asset shows perfectly which columns come from which table. That’s amazing!
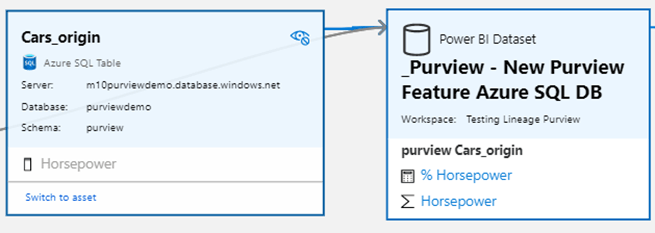
Now let’s have a look at the columns we created. First, “Horsepower divided by Cylinders” (from Power Query):

It shows exactly what we wanted, the two columns we used to create the single column in the dataset.
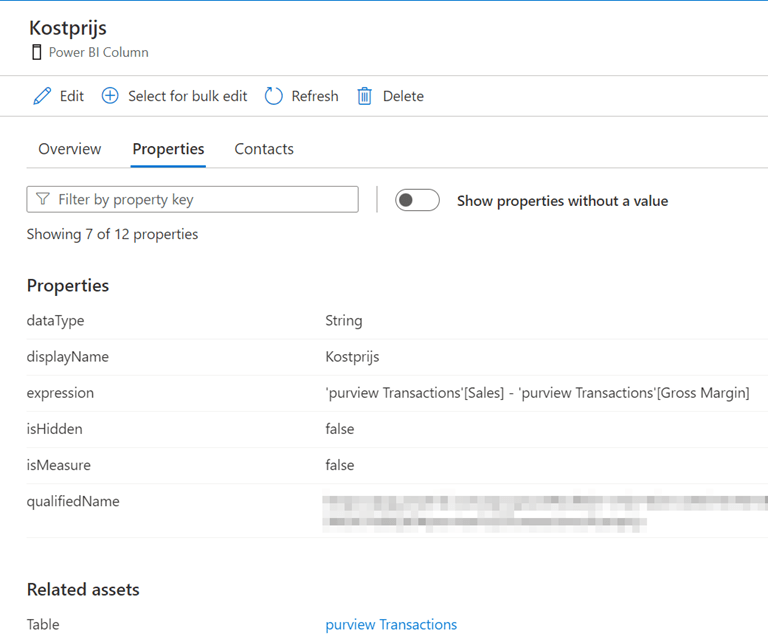
Second, the Kostprijs (which is cost price, but in Dutch):

You can see the two columns in the table, but also in the dataset! And when we click on the calculated column we get to see how this column is created:
Now for the measures it works exactly like that:
But unfortunately, you cannot see (directly) how we want to see this % of Horsepower (by Model, which was in the remove filter). But again, in the details properties tab you can see the expression used:

The only weird thing now is that it’s noted as a Power BI Column, but also as a measure.
When selecting the cylinder measure, it automatically shows the related measures for that one. In this case, Test Division:

And last but not least, our Test Division measure:
I’m happy to say everything is now working as expected, which makes Purview such an incredibly powerful tool!
How to use it now?
Clients have been asking if there is any good way to document measures and calculated columns and for now I’ve been telling them to extract DMVs and load them into Power BI so end-users can search for the measures. But when they want to know where the data is coming from (the original table), that wouldn’t be possible. With this lineage feature it is, and it’s working even better than I was expecting.
All your measures and columns can now be curated by Data stewards and the end-users have one place to go (the Purview environment) to view the calculations, their meaning, where it’s coming from, and who’s responsible for it! Now that’s a major step forward!
Wrapping up
I’m very happy Microsoft added this feature for Azure SQL DB’s, and hopefully, other sources will follow soon. It makes Purview such a powerful tool. Finally losing the need for manually maintained Excel files. Let’s see what the future of Purview has in store for us!
Take care.

HI,
We can only see the Azure DB SQL server instead of all the relevant columns.
Do you have any idea how to fix this?
Thx, awesome blog!
LikeLike
Hi Jana VR,
I’m not 100% sure how to fix it. Have you run another full scan on your Power BI asset? And make sure you check it from the dataset or Azure DB Asset. From the report itself it’s not possible.
I hope this helps!
LikeLike
Hey Erik,
We’ve tried to scan again and it still looks the same. Could it be because we only have a pro license?
Thanks for the fast response!
LikeLike
We also use import modus and not live query. Maybe this could be the problem?
LikeLike
Hi Jana,
I’m also using a Pro license and Import mode in my example, so I can’t yet figure out what went wrong. Did you also do a full scan on the Azure SQL DB? Perhaps it needs some more info from that asset.
LikeLike