Last year I wrote a blog about using a dark and light theme in one Power BI report. In this follow-up post, I’ll show you how can automatically change the colors, based on the time of day. Using an API to retrieve the time of sunset and sunrise and some measures to automatically change the colors. Let’s go!
Sunrise & Sunset API
First, the API. I’m using the API described on this page: https://sunrise-sunset.org/api . Just create a new query with the web connector and fill in your latitude and longitude. This is my M Query script:
let
    Source = Json.Document(Web.Contents("https://api.sunrise-sunset.org/json?lat=51.9070013&lng=4.4859321&date=today")),
    #"Converted to Table" = Table.FromRecords({Source}),
    #"Expanded results" = Table.ExpandRecordColumn(#"Converted to Table", "results", {"sunrise", "sunset"}, {"results.sunrise", "results.sunset"}),
    #"Changed Type" = Table.TransformColumnTypes(#"Expanded results",{{"results.sunrise", type time}, {"results.sunset", type time}})
in
    #"Changed Type"
This is my result:
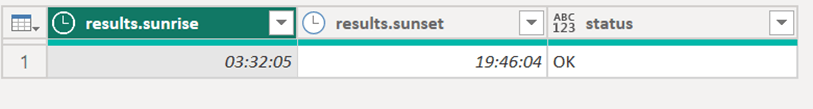
A simple table showing the time of sunrise and sunset on the day of refresh. So, this will automatically change every day if you set up the automatic refresh.
My second table is a manual input, where I’ll fill in the colors I want to use per phase of the day:
| Phase of the day | Background | Foreground | Wallpaper |
| Night | #20293c | #919294 | #000000 |
| Sunrise | #E7EEFD | #4f596e | #C8CEDB |
| Day | #f9fbff | #20293c | #f5f5f5 |
| Sunset | #4f596e | #E7EEFD | #39404F |
For testing purposes, I also added a numeric field parameter, that will change the actual UTC Time. It’s not needed, but makes making screenshots so much faster 😉
DAX Measures
Next, it’s time to add a measure that will show what is the current phase of the day:
CurrentPhase =
VAR SunRise = min(SolarTime[results.sunrise])
VAR SunSet = min(SolarTime[results.sunset])
VAR Now =
    IF(
        'Change utcNow'[Change utcNow Value] >= 0
        ,TIME(hour(UTCNOW()) , MINUTE(UTCNOW()) , SECOND(UTCNOW()) ) + TIME([Change utcNow Value],0,0)
        ,TIME(hour(UTCNOW()) , MINUTE(UTCNOW()) , SECOND(UTCNOW()) ) - TIME([Change utcNow Value] *-1,0,0)
    )
VAR RESULT =
SWITCH(
    TRUE()
    ,Now >= MIN(SolarTime[results.sunrise]) && Now < MIN(SolarTime[results.sunrise]) + TIME(2,0,0) , "Sunrise"
    ,Now >= MIN(SolarTime[results.sunrise]) + TIME(2,0,0) && Now < min(SolarTime[results.sunset]) , "Day"
    ,Now >= MIN(SolarTime[results.sunset]) && Now < MIN(SolarTime[results.sunset]) + TIME(2,0,0) , "Sunset"
    ,"Night"
)
RETURN
RESULT
Please note that I’m using the numeric field parameter, otherwise, the variable of now can be changed to UTCNOW()
Now that we can easily check what the phase of the day is, it’s time to create a measure that will change the colors. For this, I’m using three measures: One for the background, one for the foreground (mostly labels), and one for the wallpaper to create some nice contrast.
Switching Background =
SWITCH(
    TRUE()
    ,[CurrentPhase] = "Night" , CALCULATE( MIN(Colorscheme[Background]) , Colorscheme[Phase of the day] = "Night")
    ,[CurrentPhase] = "Sunset" ,CALCULATE( MIN(Colorscheme[Background]) , Colorscheme[Phase of the day] = "Sunset")
    ,[CurrentPhase] = "Day" , CALCULATE( MIN(Colorscheme[Background]) , Colorscheme[Phase of the day] = "Day")
    ,[CurrentPhase] = "Sunrise" , CALCULATE( MIN(Colorscheme[Background]) , Colorscheme[Phase of the day] = "Sunrise")
)
Switching Foreground =
VAR Result = SWITCH(
    TRUE()
    ,[CurrentPhase] = "Night" , CALCULATE( MIN(Colorscheme[Foreground]) , Colorscheme[Phase of the day] = "Night")
    ,[CurrentPhase] = "Sunset" ,CALCULATE( MIN(Colorscheme[Foreground]) , Colorscheme[Phase of the day] = "Sunset")
    ,[CurrentPhase] = "Day" , CALCULATE( MIN(Colorscheme[Foreground]) , Colorscheme[Phase of the day] = "Day")
    ,[CurrentPhase] = "Sunrise" , CALCULATE( MIN(Colorscheme[Foreground]) , Colorscheme[Phase of the day] = "Sunrise")
)
RETURN
Result
Switching Wallpaper =
SWITCH(
    TRUE()
    ,[CurrentPhase] = "Night" , CALCULATE( MIN(Colorscheme[Wallpaper]) , Colorscheme[Phase of the day] = "Night")
    ,[CurrentPhase] = "Sunset" ,CALCULATE( MIN(Colorscheme[Wallpaper]) , Colorscheme[Phase of the day] = "Sunset")
    ,[CurrentPhase] = "Day" , CALCULATE( MIN(Colorscheme[Wallpaper]) , Colorscheme[Phase of the day] = "Day")
    ,[CurrentPhase] = "Sunrise" , CALCULATE( MIN(Colorscheme[Wallpaper]) , Colorscheme[Phase of the day] = "Sunrise")
)
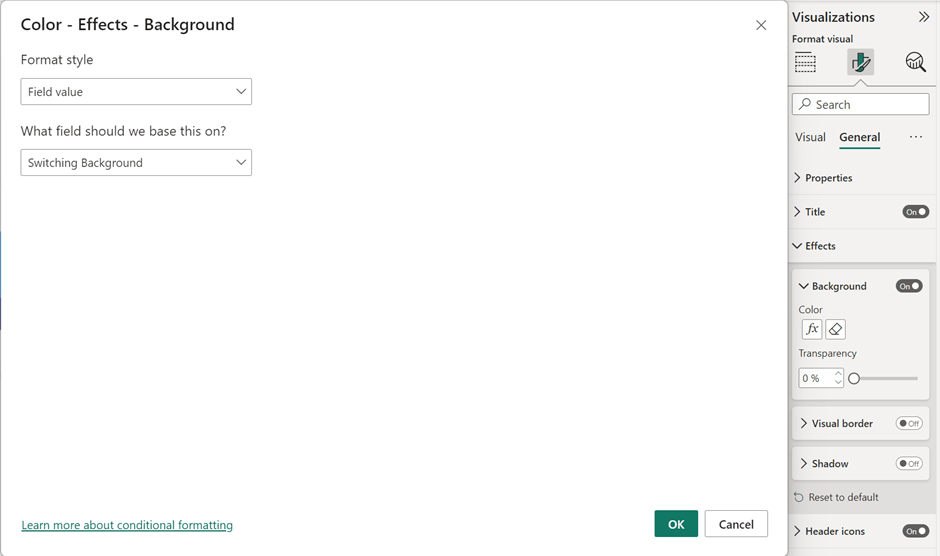
Now we use the same technique as in my old blog post, using conditional formatting on the visuals to change colors:
The result
The second item of the multirow card displays the phase of the day and you can see how beautifully everything changes according to adjusted time. Unfortunately, it’s still not possible to change the totals and column headers of a table, but you can find a color that will perfectly fit all the background colors you’re using.
Round up
Reports like this can be beneficial for people with irregular working times that need to look at the report during different times of the day, without blinding them in the middle of the night with your bright-looking report!
I’m still looking forward to seeing the possibility of using conditional formatting for every aspect of a visual, but hopefully, that will come soon!
Take care.
