In 2021, Microsoft announced Power BI Goals, a new way of tracking your KPIs inside the Power BI service. We’re now two and a half years further and there have been some nice changes, including a name change to “Metrics”. The forecast function in line graphs has been there for a long time, I don’t know exactly when they released it. I use these two functions in this blog post to check if we will reach our goals.
The Metrics Scorecard
Imagine a theme park, with rollercoasters. We want those rollercoasters to make a lot of rides with happy visitors. In my case, I have four rollercoasters with very original names that ChatGPT gave me.

In the above screenshot, you can see my actual rides, the milestones that I have per month, and the final target. You don’t have a lot of options for displaying these KPIs, but with the hover, it works pretty well.
My first roller coaster, Adrenaline Abyss, has a target of 2,000 rides at the end of the year. In November I want to have reached 1,800, in October 1,600, and at the end of September, I hope it make 1,400 rides.
To automatically show the status of your KPI, you can enable Status rules:
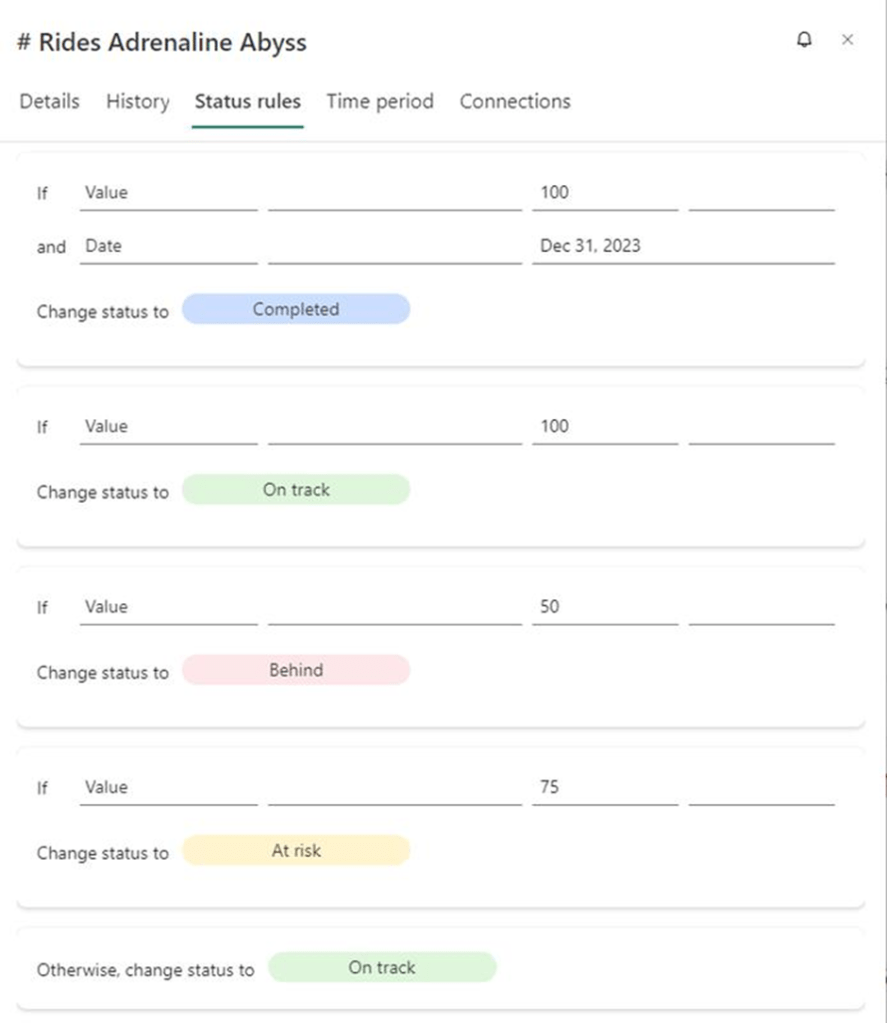
This is pretty time-consuming if you ask me, but it really helps you to show what is going on.
When you finish creating the KPIs, you can show them in your Power BI report as well, using the Metrics visual.
The forecast
Now we want to see if the targets are reachable or not. To do so, we can use the automatic forecast option in Power BI.
Let’s have a look at our second roller coaster, the Chaos Comet:

The target for December is 3,000 rides. And the milestones for November, October, and September are 2,800, 2,600, and 2,400.
When we hover over the line chart, we can see the prediction by Power BI:
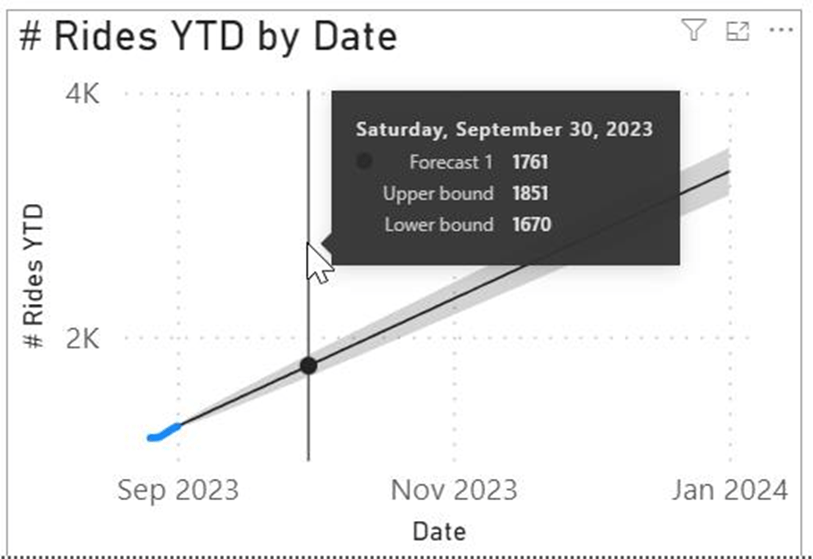
For September, the Forecast is 1,761, which is very much below the milestone of 2,400.

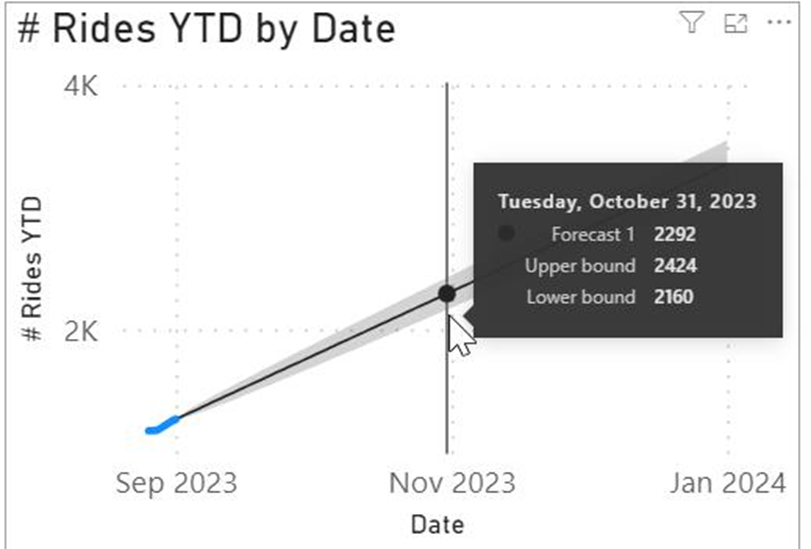
In October, our forecast is 2,292. Not very close to 2,600 which was our milestone, but we’re getting there.
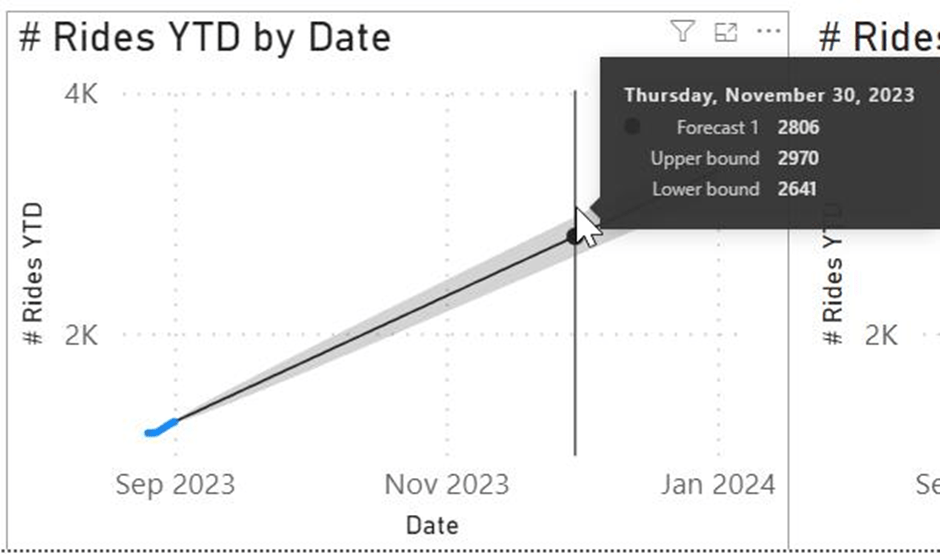
Now when we check November, the forecast shows 2806! Which is 6 rides above our milestone. But if we check the lower bound, it’s stuck at 2671, so we can’t afford to do less number of rides. And because November is further in the future, the upper and lower bound gets wider and wider.
When we reach December:
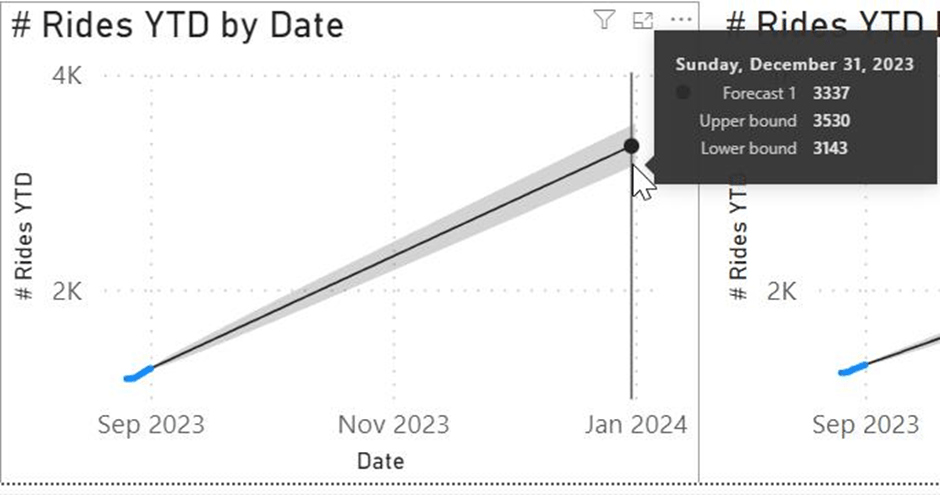
Even our lower bound is now above the target, which means we are very likely going to finish this year with success (at least for the Chaos Comet).
Wrapping up
With Power BI Metrics it’s very easy to create KPIs, add milestones and a target to these KPIs, and track them. Combining the Metrics visual with the forecasting of the line chart gives you the insides you need as a data analyst and helps you to focus on where to improve to reach your goals.
Take care.
