In my last blog, I wrote about the One Lake data hub, a great place to find all the data you have access to or are allowed to request access to. In this new post, I want to look at another hub: the monitoring hub.
The monitoring hub
In the monitoring hub, you can “view and track the status of the activities across all the workspaces for which you have permissions within Microsoft Fabric”. And it looks like this:
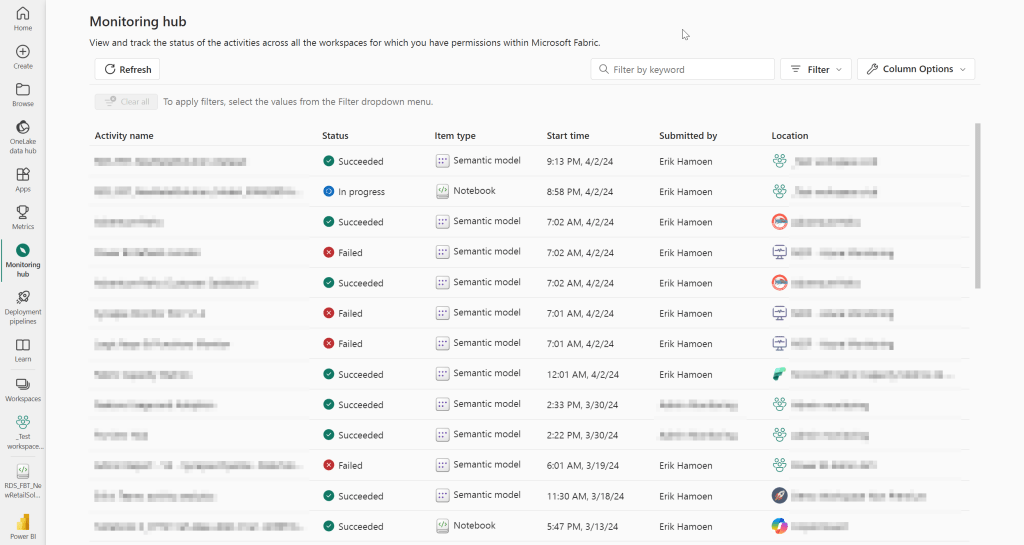
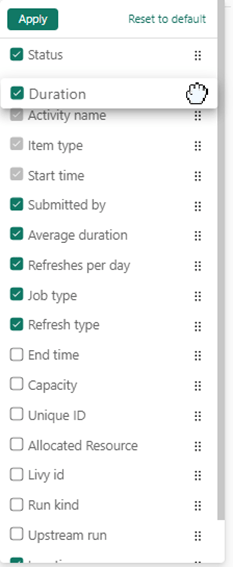
As you can see, not only semantic models are in this list, but also notebooks. But the list is even longer. So think about data pipelines, dataflows, and lakehouses. All the activities are there. And this is just the basic look. You can add or remove columns, based on your preferences. To do that, go to column options:

For example, you might be interested in the total duration, to figure out which semantic models or notebooks take a long time to process. Then you select the Duration (or Average duration) and see how much time it takes, by sorting the Duration column from high to low:

But maybe you find it easier if the status and location are the first columns? Using the six dots on the right, you can drag and drop columns on the location you want:
If you want an overview by a specific item type or a specific workspace, you can also do that, by going to the Filter, and opening Location and Item type:
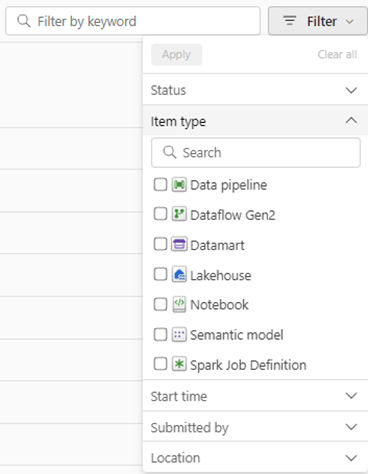
As you can see in the image, it’s also possible to search by people or systems that submitted the artifact, status, and start time. And it’s also possible to just use the search option to search by name.
Now, if I want to check which semantic models failed in the last 24 hours, I can use the filters to get this information:
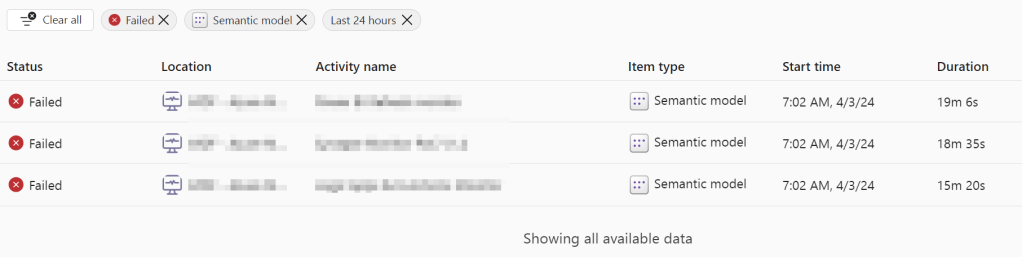
Unfortunately, you cannot filter on “artifacts that took longer than XX minutes” so I guess for that you just have to use the sort function of the columns. Also, the newly implemented folders are not (yet) available. So, the location only shows the workspace.
I really like the monitoring hub, especially because of this reason: as a consultant, most of the time, I use my company e-mail on the tenant of the client. When I go to app.fabric.com, I sign in on my company’s tenant. To go to my client’s environment I use https://app.fabric.microsoft.com/home?ctid=***. But when I receive e-mails of a failed semantic model refresh, they don’t put the CTID in the link. So those links don’t work for me.
In the monitoring hub, I can quickly find in which workspace this semantic model is, and start investigating what went wrong.
Wrapping up
After the data lake hub, I think the monitoring hub is also not a very used feature in Fabric, even though it can give you great insights when things go wrong. And especially when you’re working on the client’s environment, it saves loads of time!
At the Fabric Community Conference (#Fabcon), they announced that the Metrics page will get an interesting update as well. Not only will the KPIs be stored there, but you can also share Measure (sets) with the audience there, without sharing the whole semantic model. This will create a “Metrics hub”, so when this one goes public, I’ll also share my experience with this promising new feature!
Take care.

1 thought on “How to use the monitoring hub in Microsoft Fabric”