In my two previous posts, I wrote about the monitoring hub and the Onelake Data hub in Fabric. Today I’ll show you the Admin monitoring hub and the Purview hub!
Microsoft Purview hub
The Microsoft Purview hub is still in preview, but it already gives you a lot of information that will help you manage the data you are responsible for.
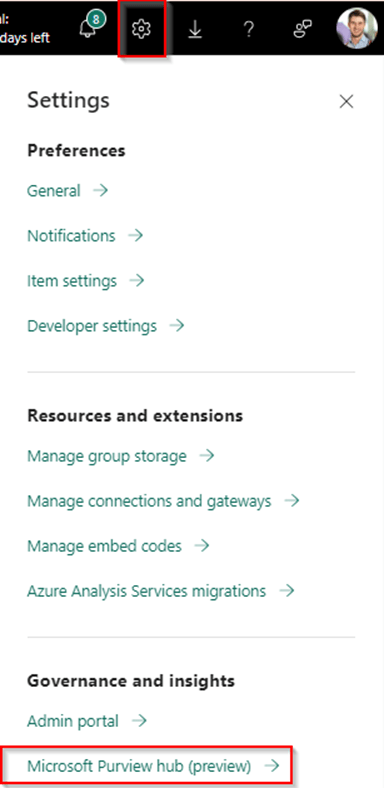
From the settings menu, go all the way down to find the Microsoft Purview hub:
Now, depending on your role inside the organization you will find different items here. Let’s start with the Fabric Administrator role:
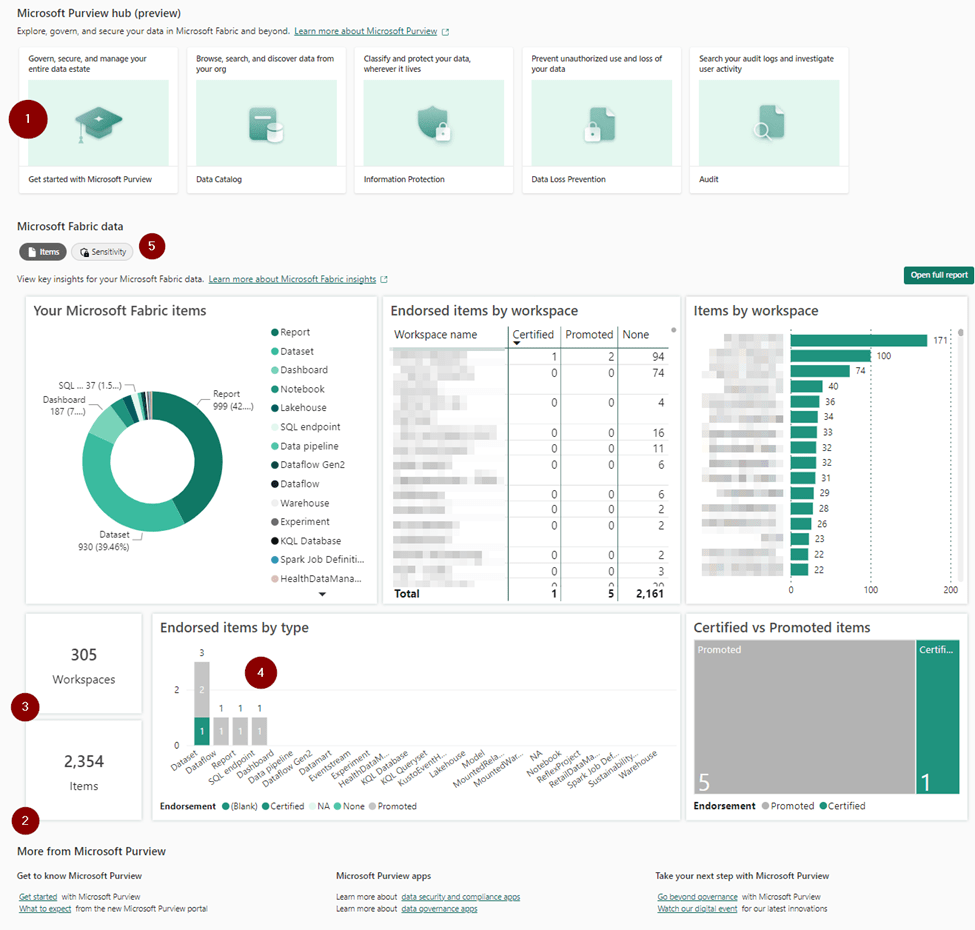
On the top bar (1), we find some very useful links that will direct us either to Purview or the Purview documentation. Below, we can find the number of items in our entire environment and the endorsement labels. As you can see in the above example, from the 2.354 (2) items within 305 (3) workspaces, only one item (a dataset) got certified and five items got promoted (4).
Just a bit below the top bar with the links, you can find two buttons to switch between a “Items view” and the “Sensitivity view” (5).
The Sensitivity view gives us information about the sensitivity labels that can be created within Purview:
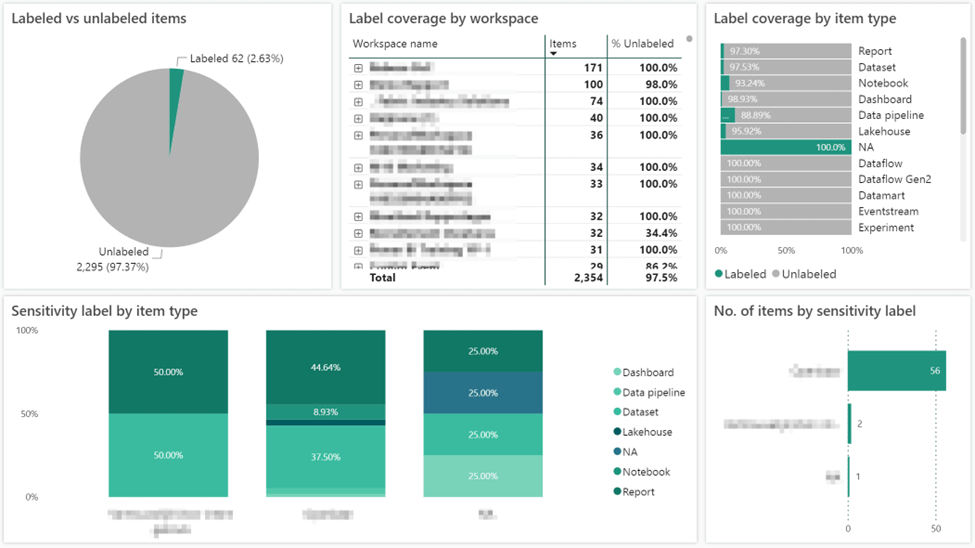
Here we can see that a lot of items are not labeled, but maybe it’s a policy within the company that a minimum of 80% needs to be labeled? Or you want to see how many items are labeled as “Public”. Remember, these labels can work all the way downstream. So, if you label a dataset as “strictly confidential”, and you add conditions to it, e.g. that it can only be opened by C-level management, this also works down to the report, or the Excel report that is either exported from your report or is live connected to the dataset.
Now, when we switch to a Non Fabric administrator user, we get way less information than before:

The top bar has only two items. So you won’t be able to directly navigate to the Security & Compliance portal (which is also a part of Purview) and instead of seeing all the workspaces and items, you only see your own. In this case, I have seven workspaces with 22 items. And none of them are endorsed! The sensitivity report will also be the same, but only includes your own items.
Admin monitoring hub
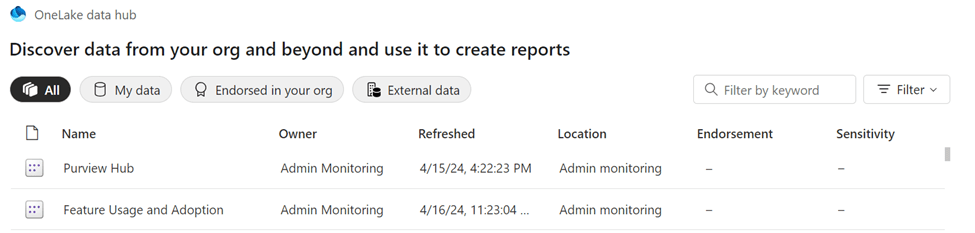
Now, the second part is about the admin monitoring hub. For Fabric administrators, a new workspace was added, that would give them a more detailed insight of the estate than you would see via the Microsoft Purview hub. It includes two reports, “Purview Hub” and the “Feature Usage and Adoption”.
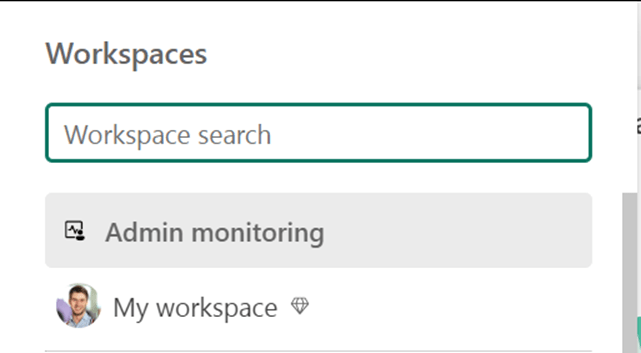
You can access the admin monitoring workspace by going to your workspaces and selecting the top one:
Or you can select the “Open full report” button from the Microsoft Purview hub. For Administrators, this will open the report inside the workspace, for non-administrators this will also open the report, but from their personal workspace.
The fun thing is the reports from your “My Workspace” can be downloaded. The reports from the admin monitoring workspace cannot. But let’s stay in the portal first.
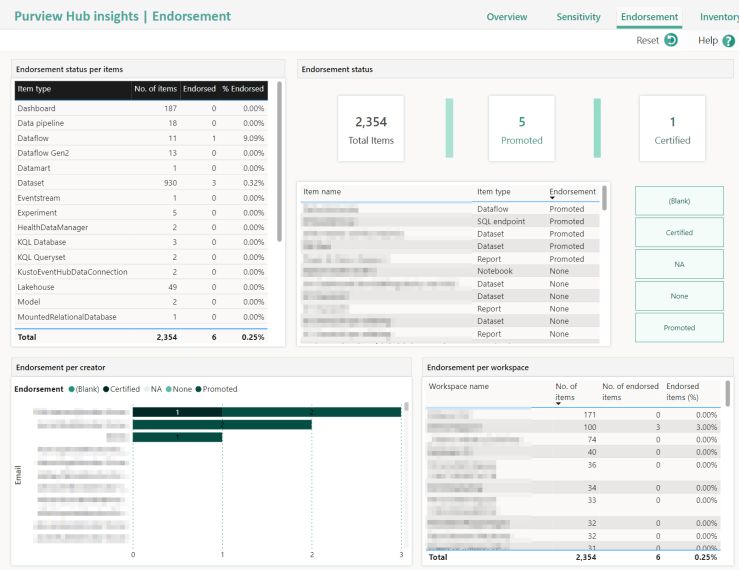
The Purview Hub
When we open the Purview hub, we get a nice overview of what is created in our Fabric environment, the use of endorsement labels in our environment, sensitivity labels, an inventory, the Items page, and the sensitivity page (which is what you see in the Purview hub as well). There’s also a Help page, but that doesn’t give you any information and it’s just blank.


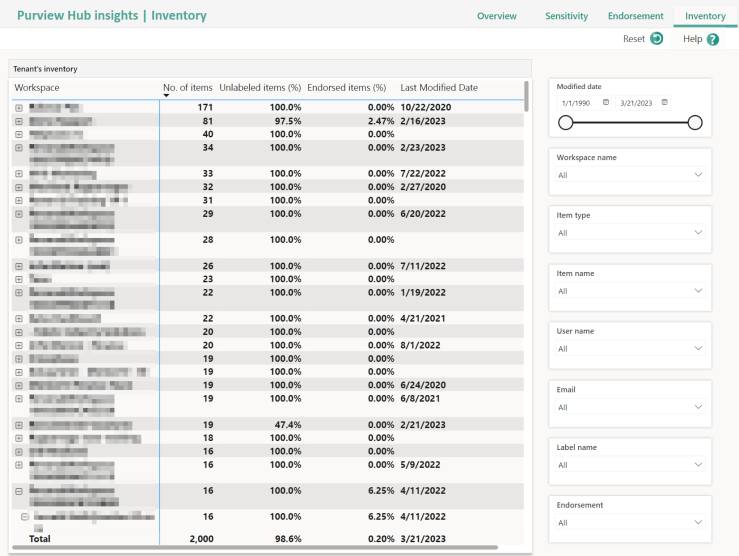
Now, I want to pay some extra attention to the Inventory report. It’s very nice that I can see everything in my environment, and that I’m able to filter in many ways. But I don’t get how they modeled this dataset. For example, in my “Demo Rapport” Workspace, there are three people who created something there, but instead of only listing those three people, everyone is there!

And when I drill down on my own name, I see all artifact types, every created. And even worse, when I drill down on the report, I see all the reports, in the entire environment!
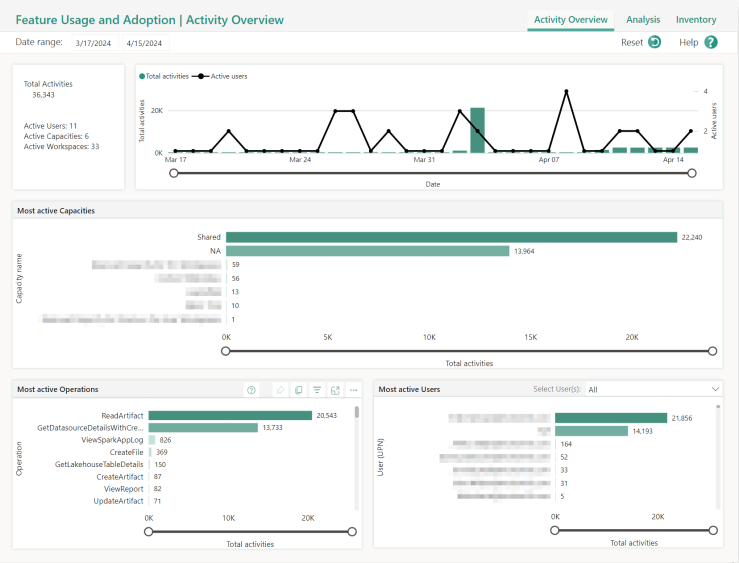
Feature Usage and Adoption
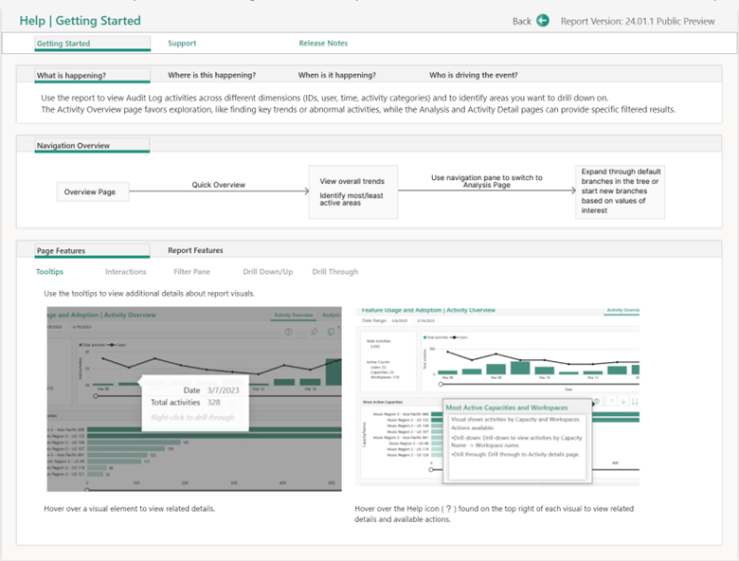
In this report, we can find activity information. Questions like: Who is doing what in my environment, can be answered here. All this information can be found inside the Fabric/Power BI APIs as well. We have access to a couple of pages, the Activity Overview with a drill through to more detailed information in “Activity Details”, Analysis, and an inventory page. And there is a Help page that works!

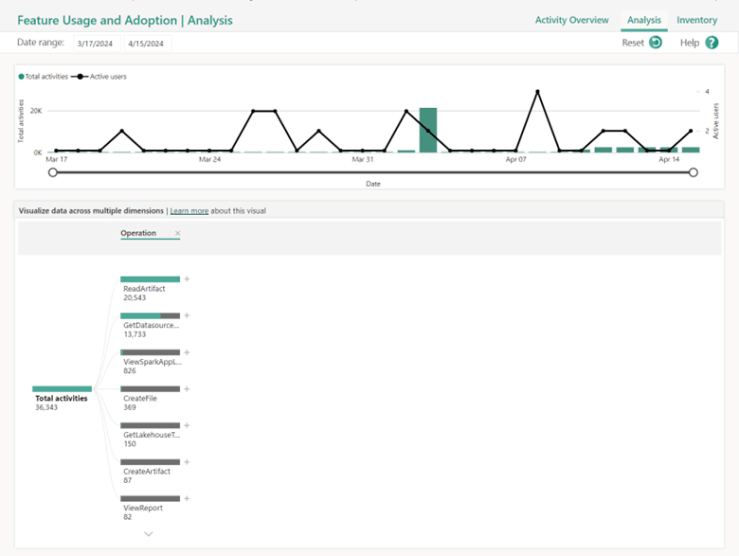
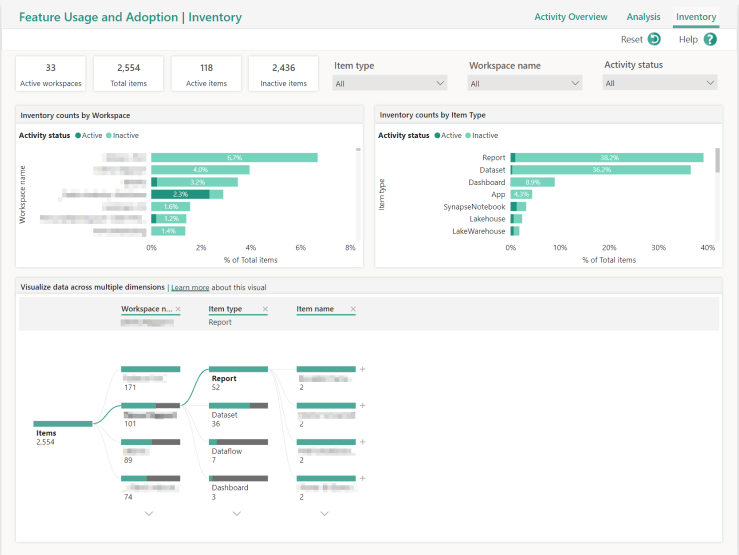
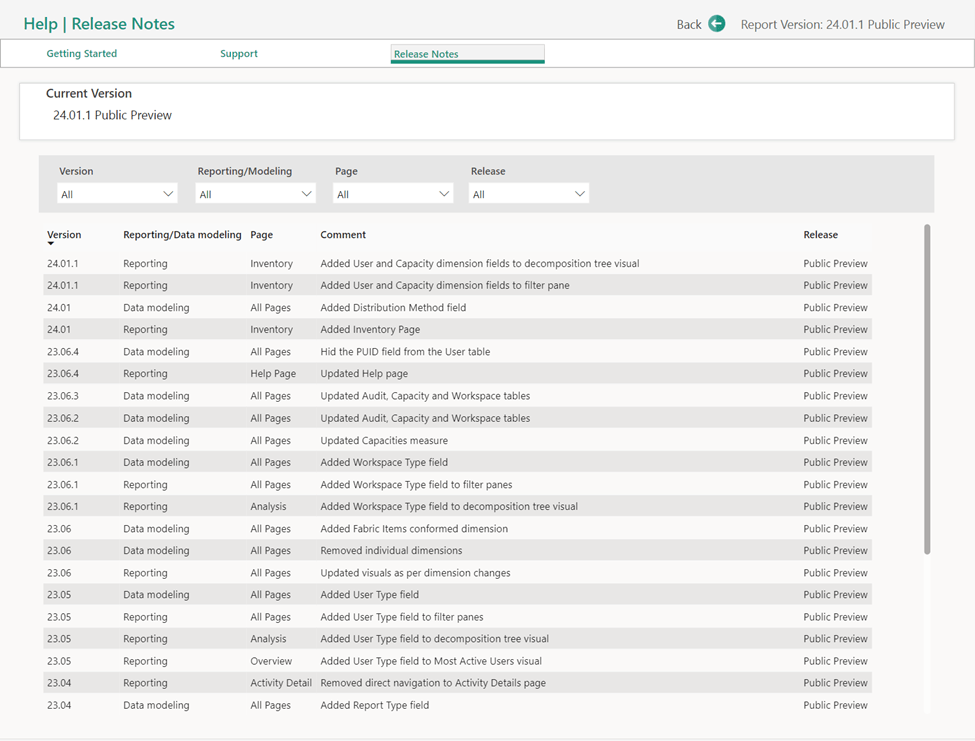
The Analysis and Inventory report can really help me see what is going on in my Fabric Environment, at least way better than the Inventory report from the Purview Hub. They even give you release notes:
Wrapping up
The Admin Monitoring Workspace and the Purview Hub can really help you to figure out what is going on in your Fabric environment. But it’s quite limited. To gain full control of your Fabric environment, you can start using the Fabric/ Power BI APIs to retrieve the same information.
Two more things: You can create a live connection to the semantic model of the two reports:
That way, you can also create your own report, without having to go through the troubles of creating your own pipelines. It’s worth it, though!
Then the last thing: At Fabcon I saw a glimpse of what is coming for the Purview integration in Fabric and the Purview Hub report. It’s exiting!
