One of my clients recently asked me: “I want to use Row level security (RLS) for this report”. The problem however is: It’s a very big model, used for over 30 reports, and they didn’t want RLS for all the other reports. Report users only get viewing rights (via the app) and there is a limited amount of report creators.
- First idea: make a copy of the table. Problem: 6 million extra rows.
- Second idea: make a copy of the whole data model (or at least the required tables). Problem: one extra model to maintain (and to keep in sync with the main model).
- Third idea: Create a live connection, add a table for the RLS, and use that data model for the report. Below you’ll read how I did that.
The main report
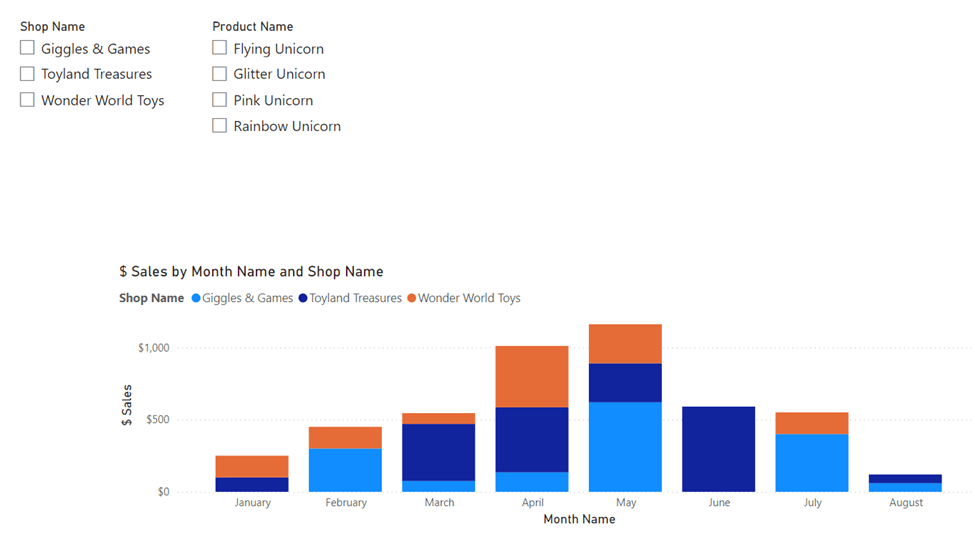
First, let’s recreate the model a bit. Imagine a group of shops that all sell the four same products. Here’s what the report looks like without RLS:
The data model:

After we publish this model, it can be used for all the reports they want to create, which do not require RLS. Now let’s go create the second data model.
The second data model
First, we create a live connection to the data model we just published, and after that, we try to import some extra data. The only way to do that is when we enable DirectQuery over a live connection:

After we select Add a local model, we can add more data.
In the table, we only add our three store names.
Now the data model looks like this:
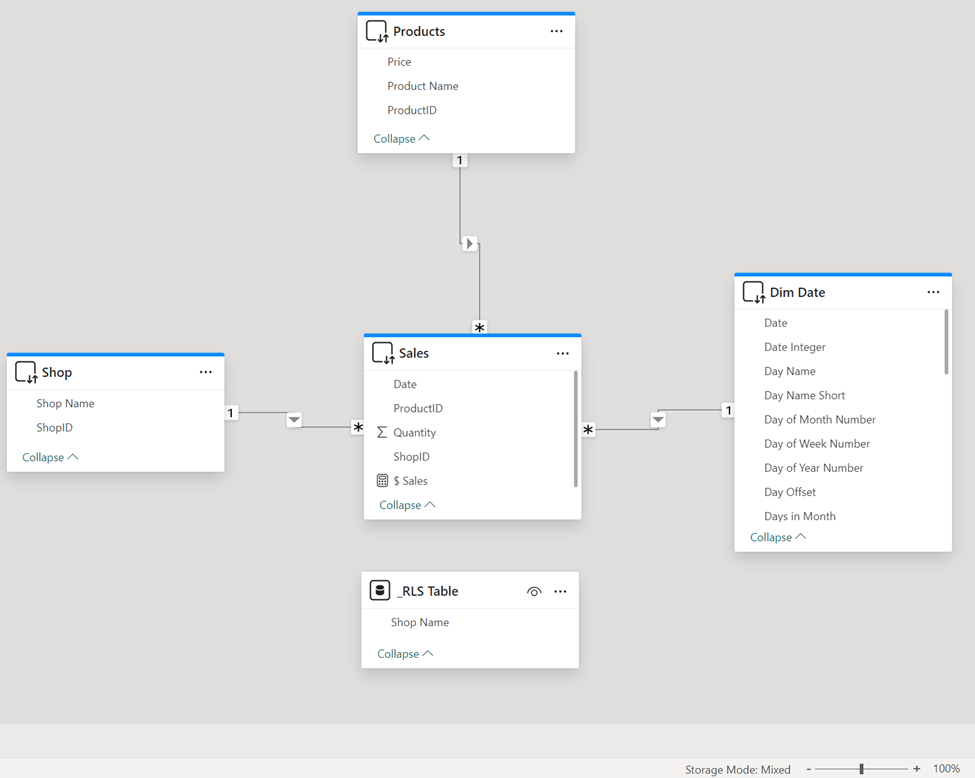
Please note the blue bars (which means the live connection) and the Storage mode: Mixed at the bottom. And now the magic is happening, because how can we use our _RLS Table to actually filter the Sales table, if there is no relationship between them? Say hello to calculation groups!
Note: when you enable calculation groups, you can’t use implicit measures anymore!
Our Calculation Group only gets one item:
RLS Filter =
CALCULATE(
    SELECTEDMEASURE()
    ,KEEPFILTERS( Shop[Shop Name] IN VALUES('_RLS Table'[Shop Name]) )
)
We then put this calculation item in our Filter Pane to filter the entire report:

What this will do, is put all the measures that we add to our report in a filtered state. Where it only shows the values from a selected shop. Now it’s time to create the roles for RLS.
Per store, I make one role that filters on only that store:

Now this is how the report looks like without any role:

And this is how it looks like when a role is selected:
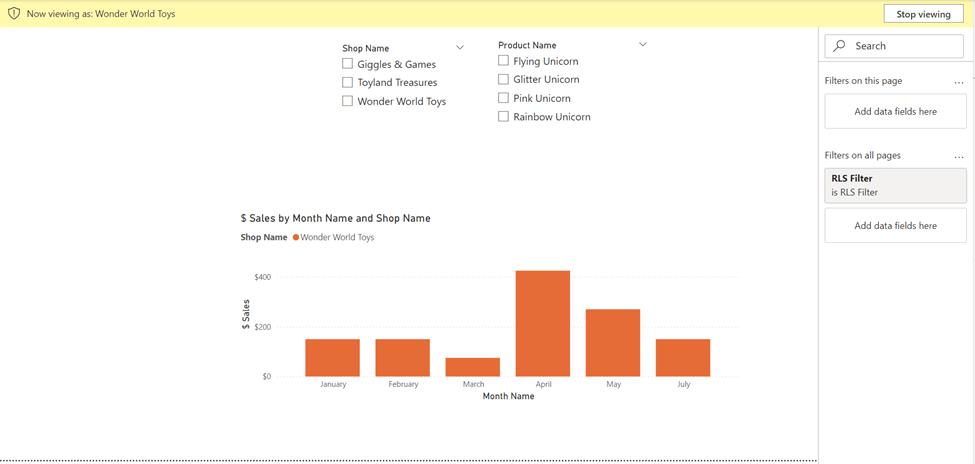
So, as you can see, we finally have RLS! But, we can still select all the shops. This can easily be solved by creating a new measure:
_ Filter Shop RLS =
INT(
    NOT ISEMPTY(
        'Shop'
    )
)
Now we put this measure as a visual level filter for our shop slicers, and equal it to 1:

Now we can publish the report to the service, and add the people to the specific roles. When we go to the lineage view of our workspace, this is how it looks like:

Every change we apply to the original data model will automatically reflect in our RLS model! So you only have to maintain one data set, and for the RLS model a single table.
I hope this helps whenever you get this question!
Take care.
