When I started as a BI consultant, the only way to create page navigation in Power BI was by using bookmarks and my other main use for bookmarks was creating a “Clear filters” button, to reset all my slicers in a report. In this article, I’ll show some extra usage for buttons and bookmarks.
Relative Date or Between date?
One of my customers asked me: Erik, we want to select the last seven days, or thirteen weeks, or six months. But, we also want to be able to select a start and end date. The solution was easier than expected, using bookmarks and synching slicers.
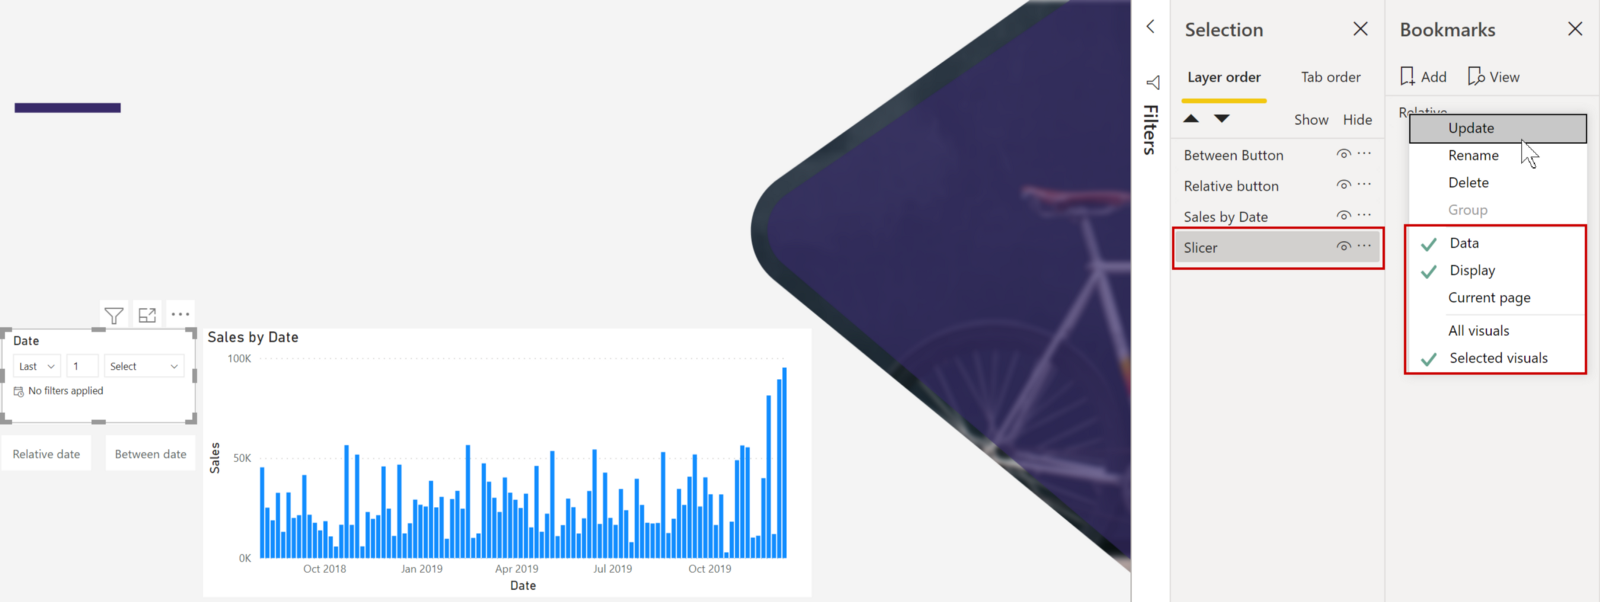
First, I create a slicer with a date and two buttons: relative date and between date. the next step is to create a bookmark with a selection of Data, Display and Selected visuals:
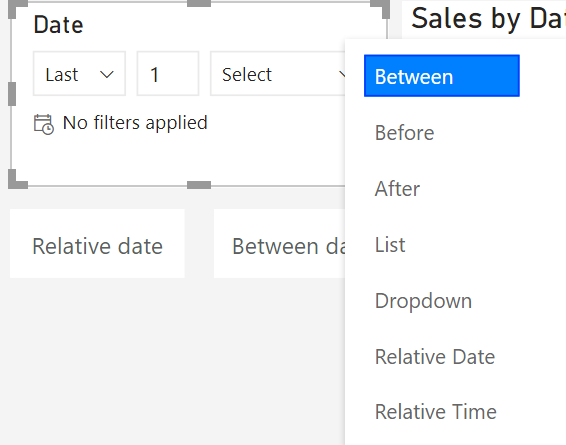
The next part is to change the slicer to between:
Now you create a new bookmark and do exactly the same. Now put the actions to the corresponding buttons, and you’re done!
Because you can sync the slicers over other pages, it also keeps the state you selected on other pages!
Give more attention to a visual
Sometimes you want to give the viewers of your report some extra details, but you want them to navigate to another page. For these use-cases, I create a spotlight bookmark.
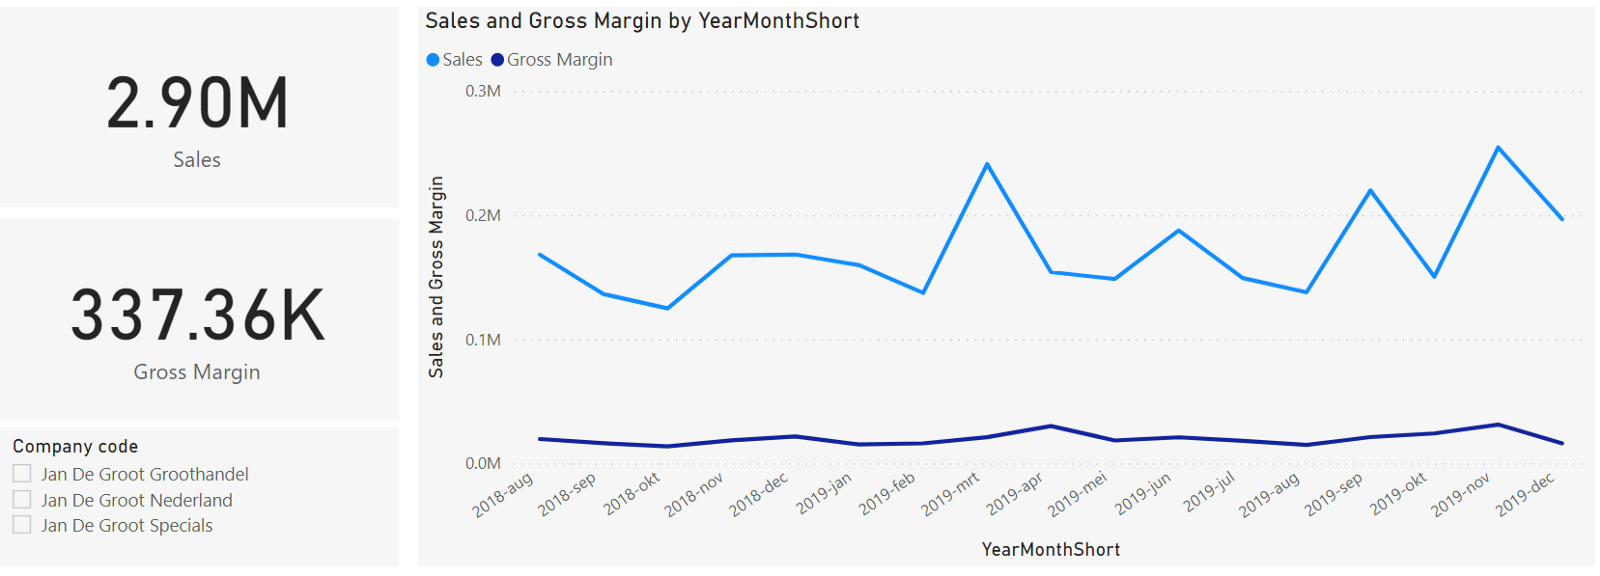
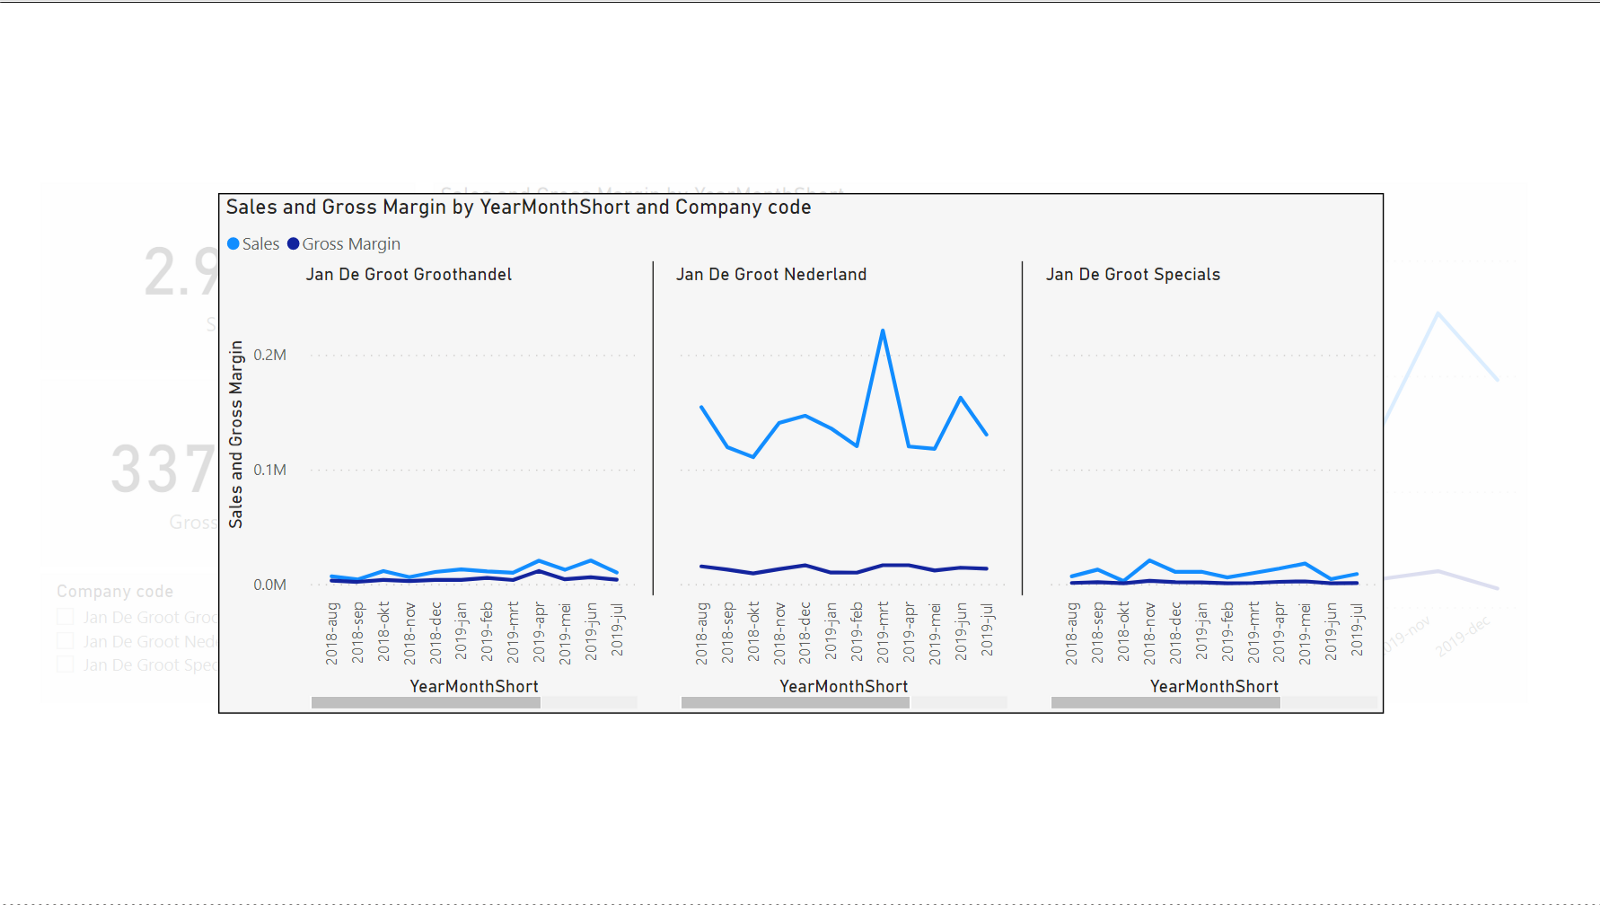
My sales and margin come from three companies. Because I want to show my Sales and Gross Margin in the same chart, I can’t add a legend. Of course, I can select each company individually and compare them but that isn’t really user-friendly. Instead, I want to show three charts, one for each company.
To achieve this, I create a shape, covering the whole page. I remove the Fill and the Line and add a background color with 15% transparency. Then I duplicate my chart you can see above and put it on top. Next, I drag the Company code to the Small multiples field. After some formatting, this is the result:
The next task is to create a bookmark called Spotlight. It’s important to uncheck the Data field since you don’t want to keep the current selection as standard when you open this bookmark.
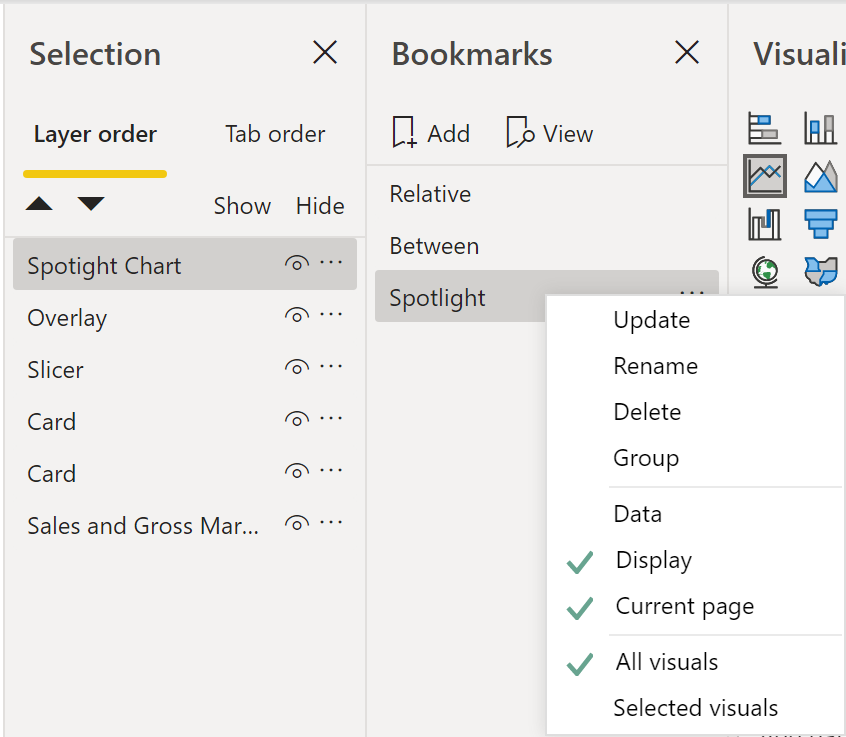
The next part is to hide the Spotlight Chart and the Overlay visuals. Now I create a new bookmark with the same settings and call it “Back to normal”. The Company code slicer is replaced with a button, enabling the Spotlight bookmark. Make sure to put this button lower in the layer order than the spotlight chart and the overlay. On the overlay shape, I add the action for our latest bookmark “Back to normal”. This is the result:

Clear Filters
One of the most asked future: Can we just clear all filters at once? This one is very easy. I created a page with three slicers, all without any selection. The next part is to create a bookmark called “Clear Filters”.
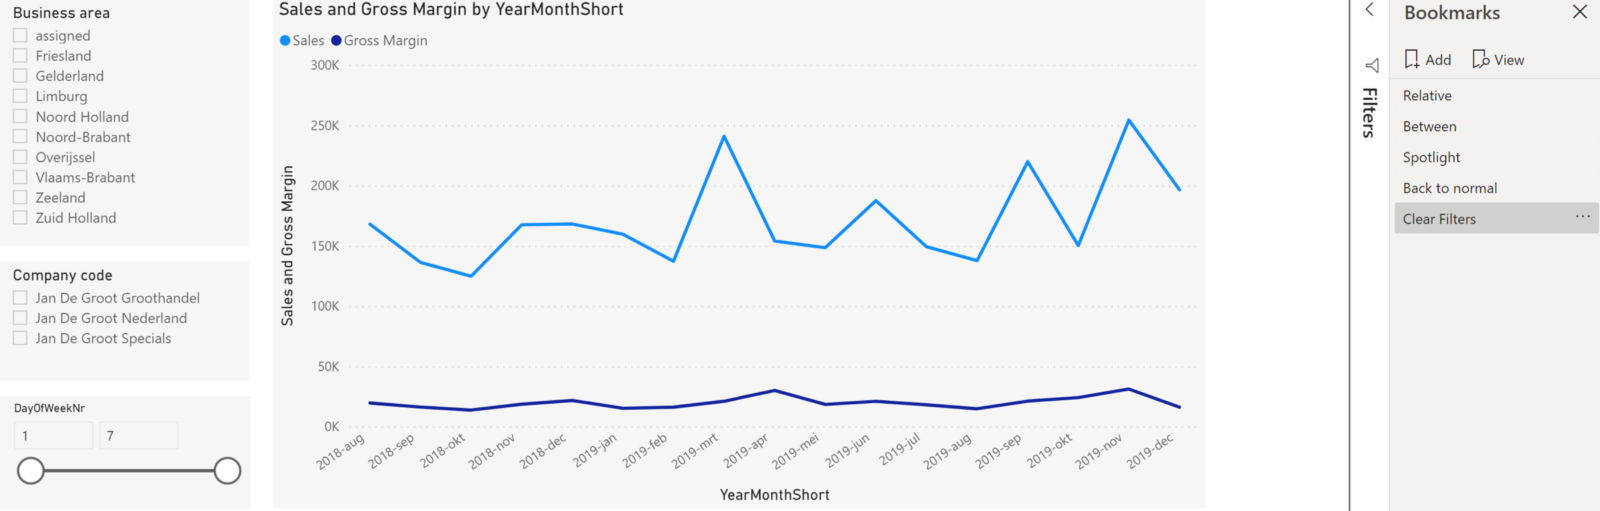
The next thing to do is creating a button, with the text “clear filters” and you’re ready to go:
Monthly Sales or Year-to-Date Sales
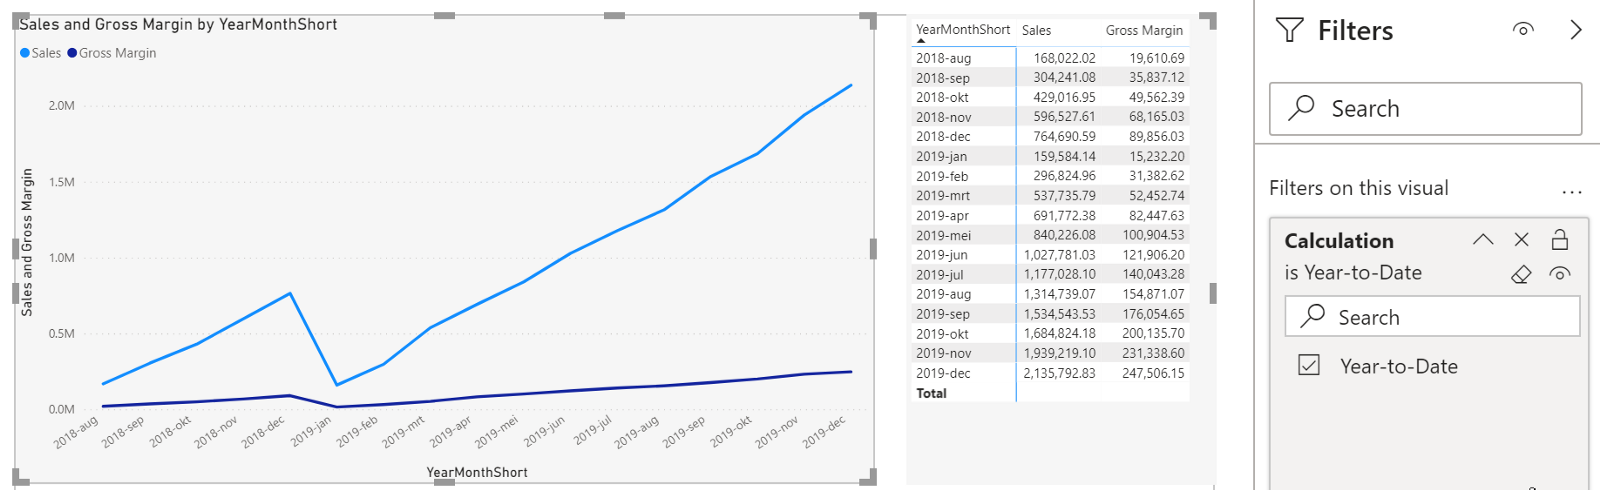
Sometimes you wish to see your sales results not only per month but in a year-to-date overview. And in other cases, you just want to see it by month. So switching between these two states can be really helpful! With a calculation group, I created a Year-to-date item so I can view all my measures in a YTD way.
The next part is duplicating the visuals. To keep things easy, I create two groups in my Section View. Monthly and YTD. In my YTD visuals, I add the YTD calculation to the filters on the visual.
Now I create two buttons, one for Monthly, the other one YTD. I give one of them a light blue background, indicating that that one is active. Duplicate the buttons and switch the background colors. Add them to the corresponding Selection group.
The last thing is to create a bookmark for the Monthly visuals and one for the Year-to-Date visuals and assign them to the buttons:
Hopefully, this article has given you enough inspiration to get started with this function within Power BI
Take care.
