One of the clients I work for, got a request which includes geofencing. A geofence is a virtual perimeter for a real-world geographic area. It needs at least three different coordinates to create a shape. In this article, I will describe what my colleague and I did to complete this request and what is needed for that.
Creating the geofence for your area
Using https://geojson.io/ you can create one or multiple areas that you want to use as a geofence and directly see the coordinates.
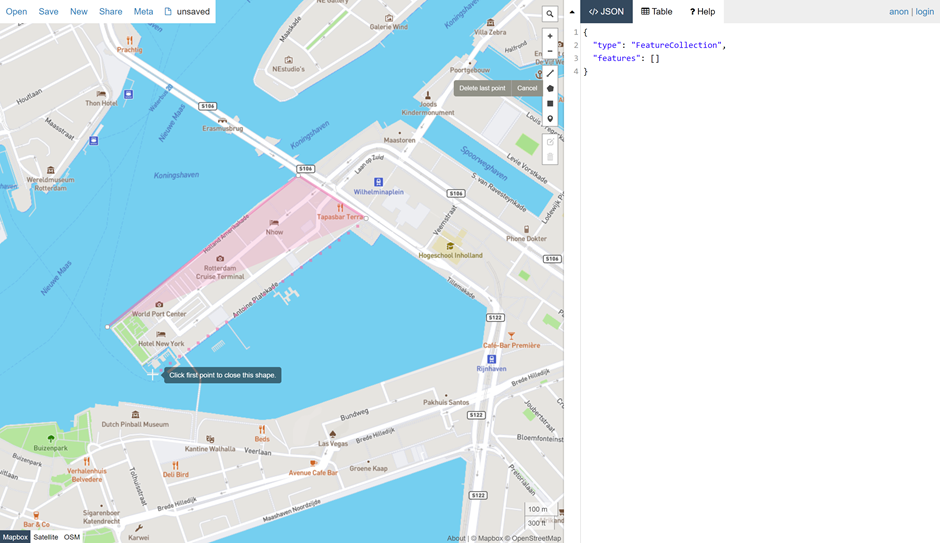
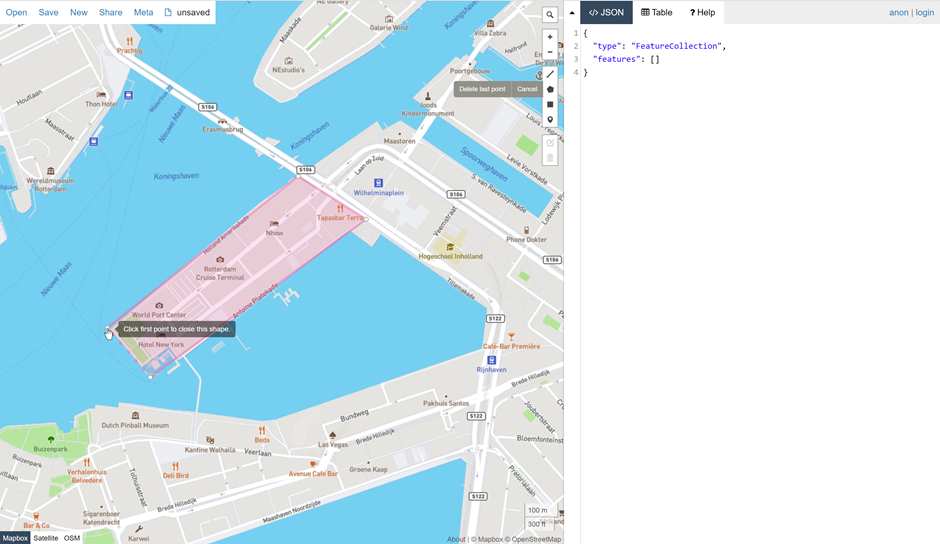

When we close the shape, you see the coordinates on the right side and as you can see, the first and the last one are the same. This way we have a full shape (in this case a part in Rotterdam) which we can use as our geofence. We are going to need these coordinates but in a slightly different way. We are going to save them as a WKT String. In Power BI we are going to use the custom visual Icon Map by James Dales. I have downloaded the 3.1.15 version, which is while writing this article the latest version.
Show the geofence in Power BI
To show the shape in Icon Map, I add the coordinates as a polygon in a table and add two extra columns: ID and Size. They are used as Category and Size in the IconMap visual and are required to show at least something. The coordinates are round up to 6 decimals, otherwise, IconMap can’t show it.
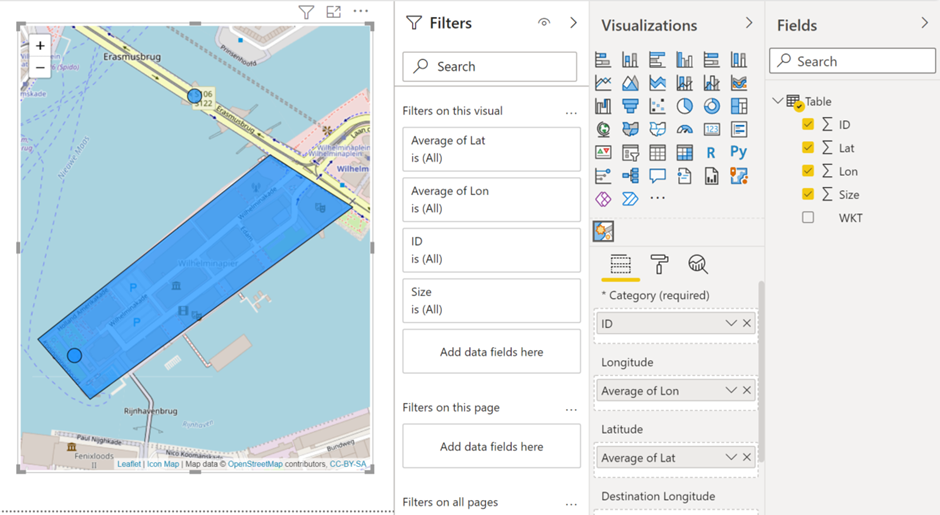
This results in the following report:

As you can see, I only added the fields ID and Size in the fields pane. For the WKT shape, we need to go to the formatting pane. Under Object, we can use conditional formatting to select the WKT field:

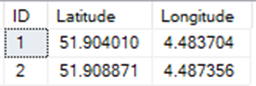
The next thing to do is add a few extra location points, for example someone who sends his GPS signal to us, so we can check if that signal is inside the geofence. To do that, I need to add two columns to my table, Latitude and Longitude.
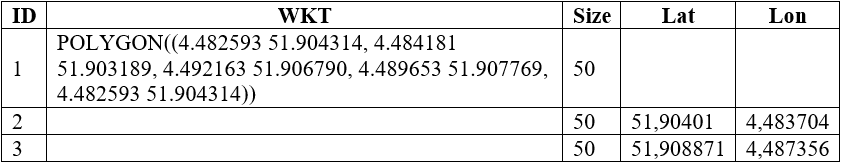
If you want to try these values yourself:
POLYGON((4.482593 51.904314, 4.484181 51.903189, 4.492163 51.906790, 4.489653 51.907769, 4.482593 51.904314))
Lat Lon 1: 51,90401 4,483704
Lat Lon 2: 51,908871 4,487356
The ID and Size columns are still required, but the WKT column we can leave empty for now. When adding these fields to the Longitude and Latitude field in the Fields pane, we get the following result:
Now we can see if a GPS location is inside our geofence, but I want an indicator that it’s inside this geofence. To do that we are going to move this data to a SQL table. There we can use the function ST_INTERSECTS to check if the data point is inside the polygon, or not.
Use SQL to identify if a value is inside the geofence
In SQL we will have 2 tables. In 1 table we have the polygon and in the other table, we have the coordinates.
The table with the polygon area looks like this:

We have an area name, the polygon in a geometry data type, and the polygon in a text format. To convert the polygon text format to a geometry format you can use the following expression:
More information about the STPolyFromText expression can be found here: STPolyFromText (geometry Data Type) — SQL Server | Microsoft Docs
Our coordinates table looks like this:
Now we want to know if one of our coordinates is inside our polygon. We can do this with the ST_INTERSECTS function available in SQL. More information can be found here: STIntersects (geometry Data Type) — SQL Server | Microsoft Docs
In this case, we use a view to prepare the data for our Power BI report:
In the first part, we select our coordinates and convert our latitude and longitude to a geometry point. The data will look like this:

In the second part, we identify if a coordinate is inside our polygon area. This is done with the STIntersects function in SQL. We use our geometry point column (LatLon) to check if this is inside the polygon. We do a CROSS JOIN to our area table so in case we have multiple areas we check them all. The data looks like this:
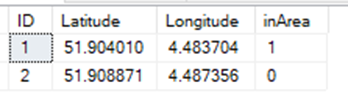
As you now can see is that the coordinates of ID 1 are in our polygon area.
The last step is to create one table which contains both the areas and the coordinates with the indicator if they are inside a polygon area or not. The size is required by the visual. The result of the table looks like this:
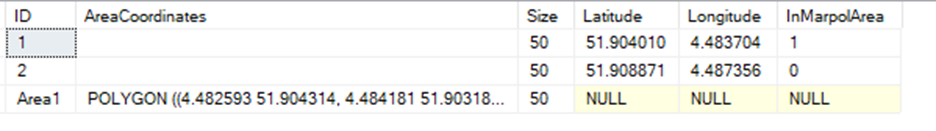
We have two coordinates with one of them inside the polygon and we have one polygon area. This data can now be loaded into Power BI to create the Visual from above.
Use SQL data in Power BI
Now that we have a view with the coordinates, the polygon, and an indicator if the coordinates are inside that polygon, we don’t need our other table anymore. Instead, we will use this newly created view and finish our report.
The creation of the visual is still the same, but what we can do now is apply conditional formatting to our coordinates:
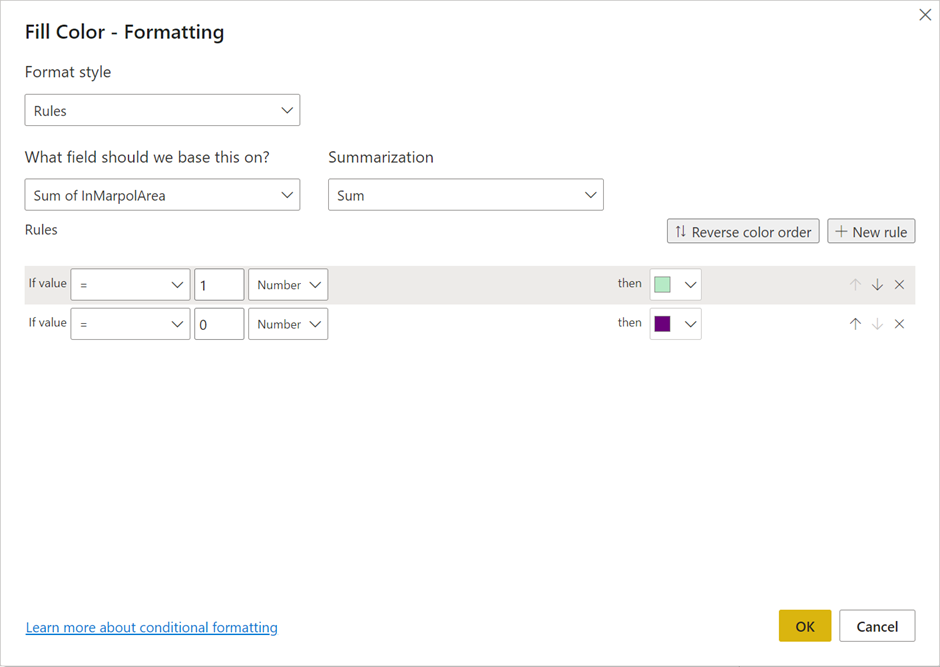

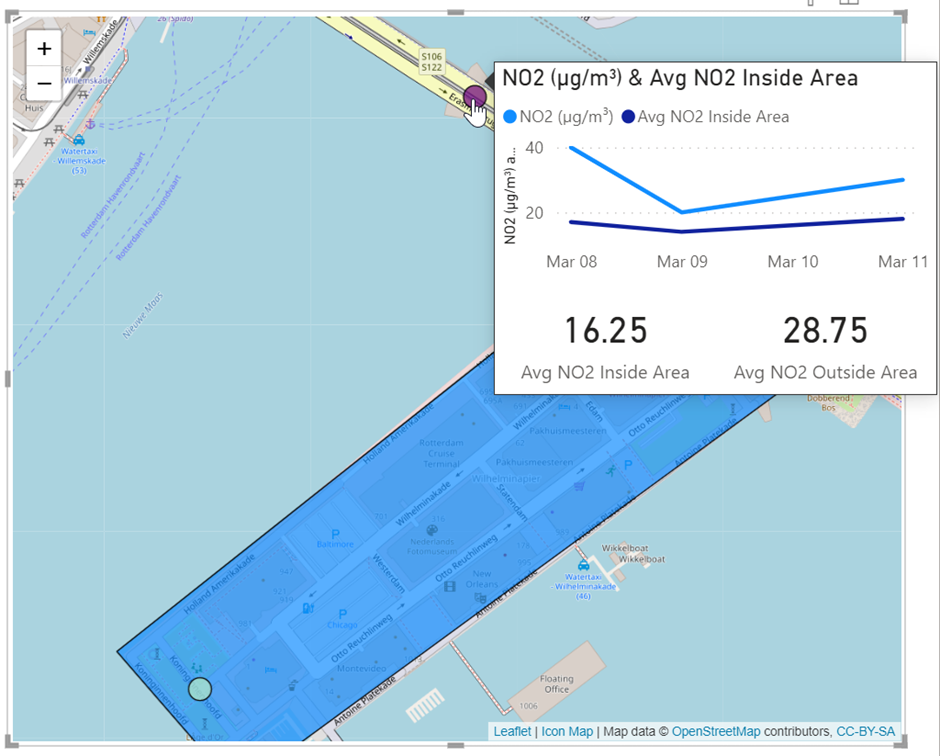
These two points don’t give you a lot of information, but it’s a great starting point of things you can do next. By adding just a bit of data, some custom tooltips we can create the following:
Roundup
And now it’s up to your own imagination what you want to show on those maps, using geofences. If you want to use GPS Tracking data, keep in mind that an ID is needed for each datapoint. If you are tracking devices at the same time and want to use one ID for each of them, the ‘Average of Longtidue’ and ‘Average of Latitude’ won’t work. You can create a measure to get the latest value for example or create an ID with 1-*** and 2-**. With conditional formatting rules, you can give those 1 & 2 IDs the same color for all their locations, and still show all the data points.
I would like to thank Lowie Pouwels for his effort in the SQL part! Couldn’t have done this without him!
Take care.
