Power BI Alerts are an interesting way to notify you when something is wrong. In this article, I will show you how to set up alerts with a variable threshold. For this example, I use a streaming dataset, created in Power BI, and a PowerShell script I got from the guys at Guy in a Cube.
So first we create a streaming dataset in Power BI:
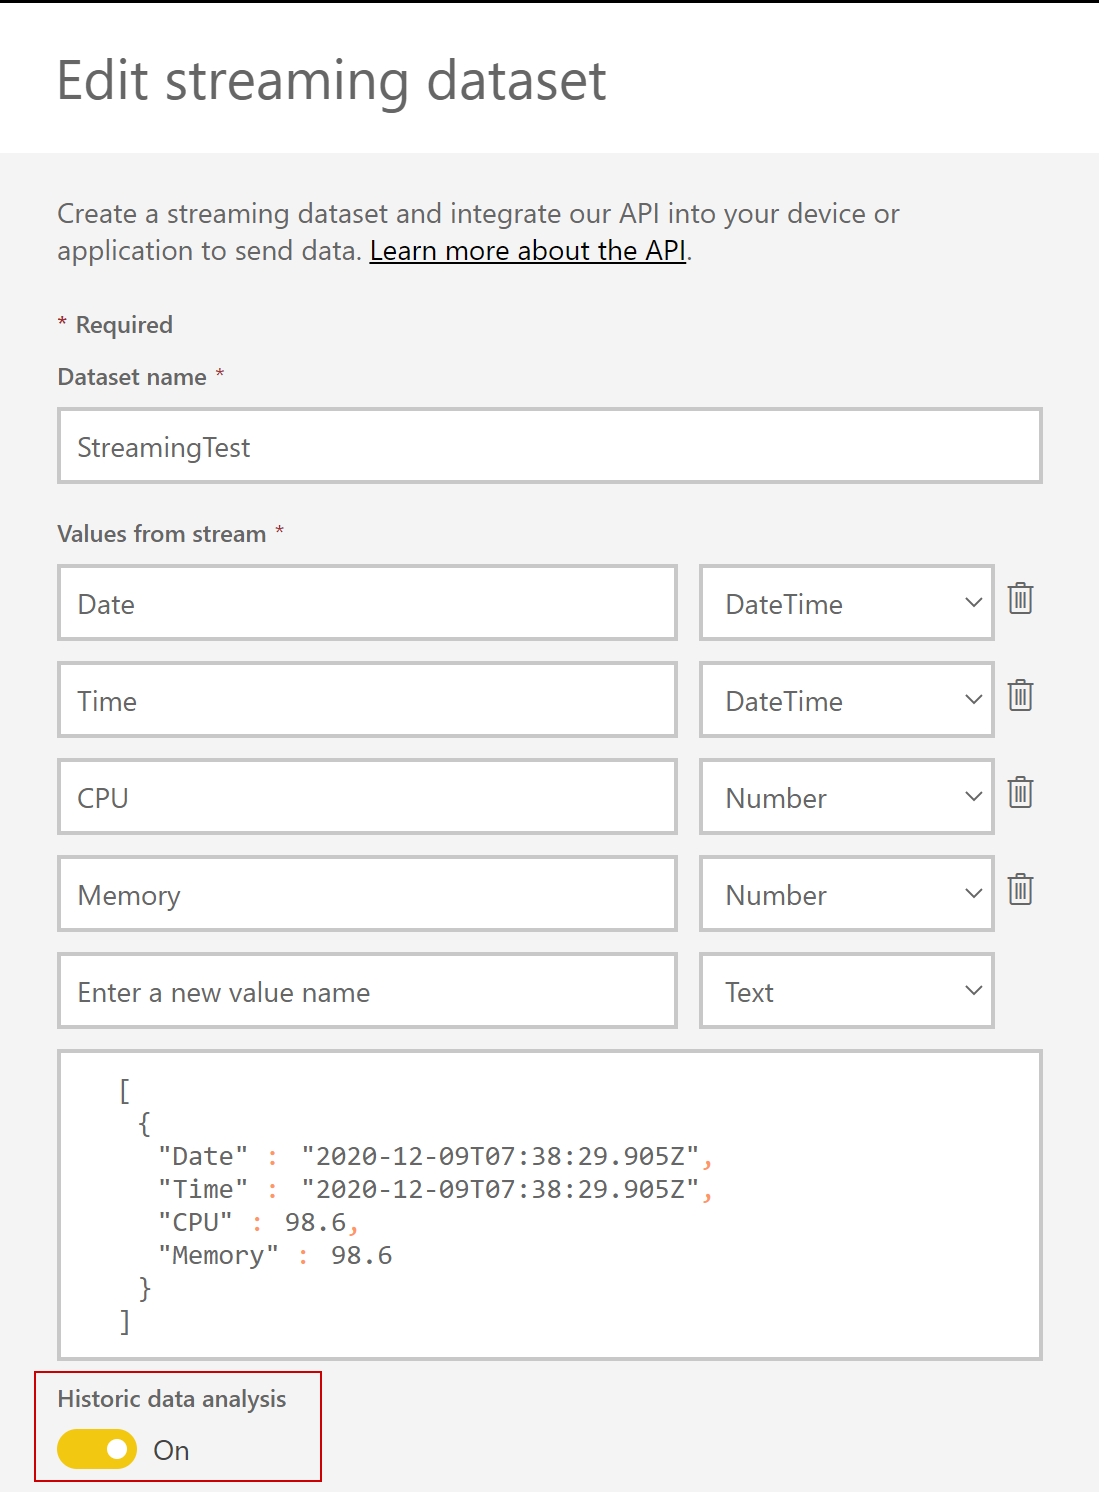
Don’t forget to turn on historic data analysis as mentioned in the video, otherwise, you can’t create a report! The values are standard so don’t worry about that now! Next, you go to API info and copy the endpoint (Push URL):

Now we copy this script, paste it in PowerShell, paste the endpoint at the variable on top and run it:
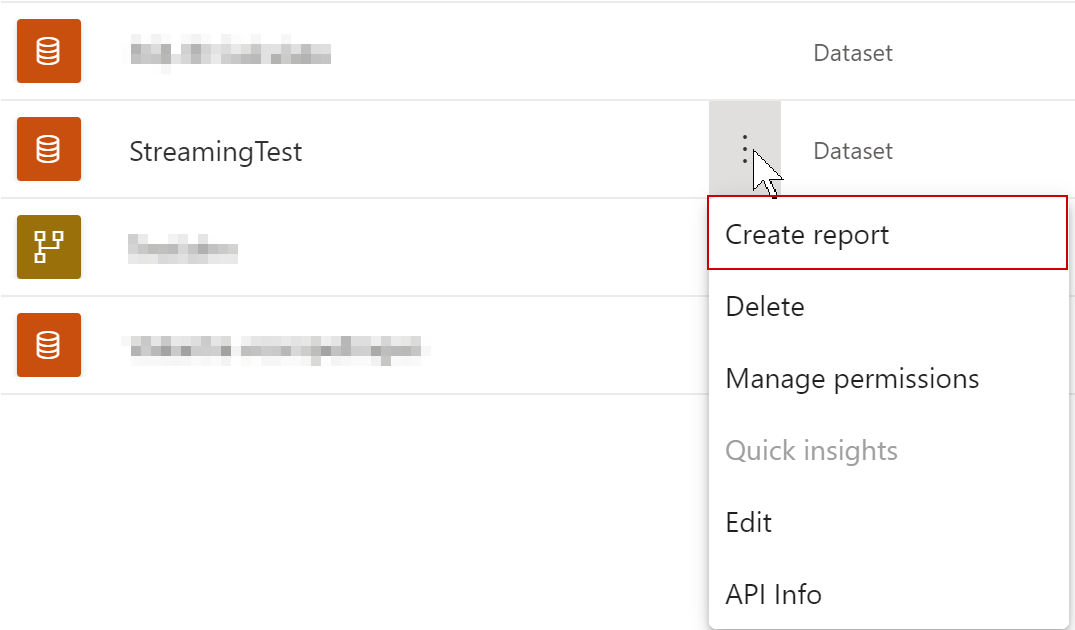
We can now create a report on the dataset:
But unfortunately, we can’t create measures in Power BI Service and we can’t download this PBIX. So the only card visuals we can make are: max, average, sum etc. and of course line graphs:

The line graph I made filters by the last 120 rows I got for my input. Otherwise, we would get a graph that is impossible to read. And on the other hand, we aren’t very interested in data from multiple hours ago, but you can always change this.
For the card with “latest CPU”, I filter by TopN (1) on the latest time, to get the latest value from the CPU. When I pin this to my dashboard I get the following results:

Now we can set alerts on my Latest CPU Card:
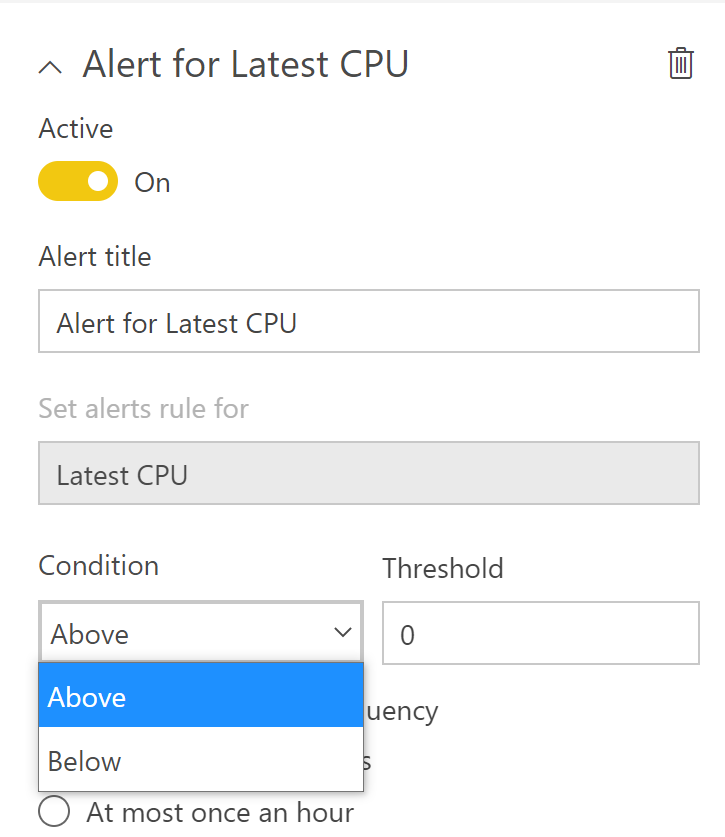
Unfortunately, we can only create static thresholds. But if we take a look at the graph, we can see a great difference between the numbers, so what I actually want is a threshold that looks at the average of the last five rows, with a margin of five, because its normal that my CPU increases, but I want to be alerted for these spikes. To do this, we have to create a new report in Power BI desktop, based on the streaming dataset, so we can create measures!
First, we have to create a measure that gives back the last value of the CPU. To do this we create a measure with a variable, that gives a table with only one row: the latest added. We then use this table to filter my measure, so we get the latest value:
Now we have to create a measure that creates the average of the past five values. Therefore we build a variable that creates a table with only the last five added rows. We then use this table to filter my average measure:
Now the last measure we have to create is a check if Latest CPU is higher than our threshold +5:
If that’s the case, it returns 1 otherwise it returns 0:

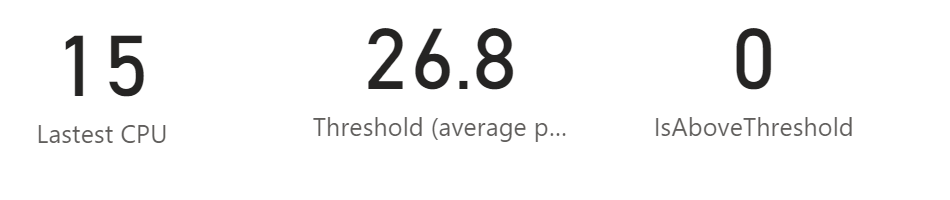
Now we publish the report to our workspace, so we can pin the visuals to the dashboard. The last thing we have to do now is creating an alert on the IsAboveThreshold visual. If it’s higher than 0, my CPU spikes above the average +5, so that’s what I create:

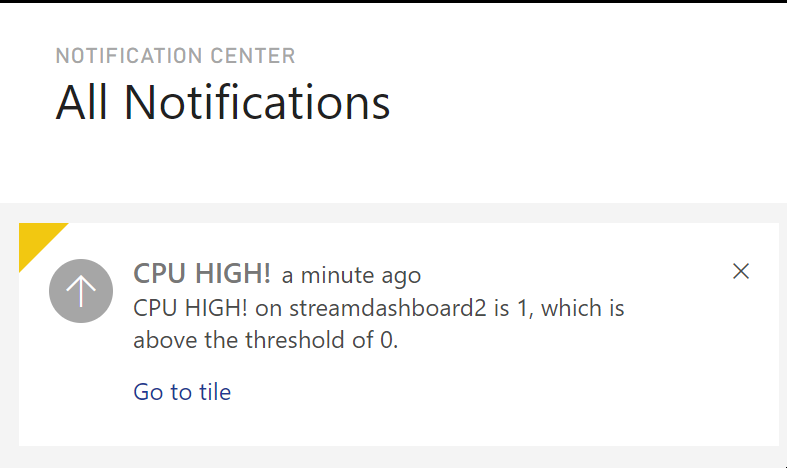
Because my boundaries aren’t that big I get my alert pretty fast:
This was mainly build to show the possibilities of a flexible threshold in Power BI dashboard Alerts. You can always change the thresholds to your own preferences, for example, an average of the last five minutes instead of five rows, an alert if it happens more than three times within thirty minutes, or creating a bigger margin of +10 or +15 instead of +5.
Take care.

1 thought on “Variable thresholds for your Power BI alerts with a streaming dataset”